
Ten Technical Tools for A3
Useful Tools for Persistent Problems
The Tools of A3 Problem Solving
The ten basic tools below are normally sufficient to cope with 80% or more of the problems teams are likely to encounter. All can be taught and practiced in our 2-day workshop.
Problem-solving teams pick and choose the most appropriate tools for each stage of their problem solving following the A3 procedure and using the A3 Summary form.
1. Problem Definition
Defining the problem, in many cases, leads directly to solutions. A good definition focuses on symptoms and effects rather than personalities and possible causes. As the project proceeds, the team should update the definition to reflect their latest information.
Poor Definition:
The Assembly Workcells are careless with glass.
Good Definition:
Glass breakage is 30% higher in workcells 3 and 4 than breakage in other cells. This delays production, disappoints customers and increases cost.
2. Questions
Questioning is something of an art-form. The trick is to ask incisive, but non-threatening questions. It is also important to use open-ended questions at the right time and closed-ended questions when appropriate. The right questions can clarify, probe, uncover evidence, and elicit perspectives. Socrates was the master of questions and Detective Columbo was also pretty good.
 Examples:
-
Why do you say that?
-
What could we assume instead?
-
What do you think causes that to happen...? Why:?
-
What are the strengths and weaknesses of...?
-
What are the consequences of that assumption?
Data Charts & Forms
Creating and using data charts and forms is an essential skill for team members. Proper forms collect relevant data easily, accurately and consistently. Charts help to interpret the data and present results to others in the organization. One of the contributing causes of the Space Shuttle Challenger disaster was the inability of the design engineers to analyze and present data effectively.


4.0 Pareto Analysis
Pareto charts ort out the trivial from the significant. They help the team focus on the most important issues and they can raise questions that encourage deeper analysis.
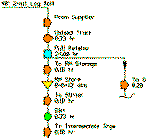
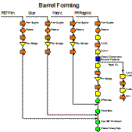
5. Process Maps
Process maps are simple and effective. They help sort out and display convoluted workflows. They help define the actual workflow and give all team members a common understanding of what takes place. The maps are highly useful in simplifying processes. As Henry Ford once said, "Every Well-thought-out process is simple." Process mapping is also intuitive and easier to learn. It does not require the level of training that Value Stream Mapping needs.
6. Fishbone Diagrams
Fishbone diagrams are invaluable in determining both all possible causes for a problem as well as the root cause. Of course, it is not the finished diagram that is so valuable, it is the thinking and discussion that creates the diagram. Nevertheless,, the finished diagram is useful as a communication tool and in presentations. Fishbone diagrams are also known as "Ishikawa Diagrams" and "Cause
& Effect Charts."
7. Statistical Process Control (SPC)
Statistical Process Control (SPC) monitors ongoing processes to ensure that the are operating as designed. But the tools of SPC and A3 complement each other. Control charts and histograms can frequently help identify the root causes of problems and the other A3 tools can improve process capability and make the monitoring more effective. SPC need not be complex or difficult. A few simple charts and a few simple concepts can be understood by anyone and those simple tools and concepts deal with 80% or so of the problems.

8. Brain- storming
Once the Root Cause(s) are identified, brainstorming helps with the development of good solutions. A few simple rules and a good facilitator bring surprising results.


9. Evaluation
A3 teams will likely arrive at several, perhaps many, possible solutions to their defined problem. They must then decide which is best for recommendation to management, Several tools for this include Weighted Factor Analysis, Positive-Negative-Interesting Analysis, and Cost-Benefit Analysis.
10. Action Plan


Problems do not get solved without vigorous implementation. The A3 teams recommend an implementation plan with tasks, responsibilities and durations. Such a plan should be part of every management presentation. Often, teams proceed to implement their own plan and this is further assurance of success.
■ ■ ■ ■ ■ ■ ■

|
The Strategos Guide To Value Stream and Process Mapping goes beyond symbols and arrows. In over 163 pages it tells the reader how to do it and what to do with it. |
The free newsletter of Lean strategy
|
PUB FEB 2016 |

|
|