Assessment for Lean Manufacturing
A Benchmarking Tool
What The Lean Assessment Does
Nine Key Areas
- Inventory
- A Team Approach
- Processes
- Maintenance
- Layout & Handling
- Suppliers
- Setup
- Quality
- Scheduling
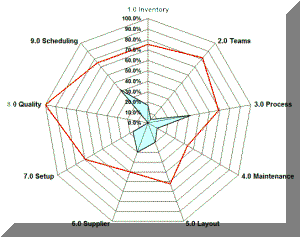
This assessment helps to investigate, evaluate, and measure nine key areas of manufacturing. The result is a deeper understanding of key issues, problem areas, and potential solutions. This format uses an Excel template to record information and score the results. It also allows for weighting the nine key areas to reflect your own processes, products, and markets. The assessment produces a "radar chart" that visually displays results.
How It Works
The Lean Manufacturing Assessment has a questionnaire that explores nine key areas. There are
3-6 questions for each area with multiple-choice answers. A scoring worksheet totals the score
for each section and provides an overall Lean Index.
This assessment allows weighting of the nine key areas. These areas are not equally important in determining overall manufacturing performance. Moreover, the relative importance of the areas varies with particular products, markets, processes, and other factors. The user must evaluate the relative strategic impact of each area.
The weighting feature also helps establish priorities for implementation. For example, in a highly automated factory with integral processes, a low maintenance score would be a critical deficiency. But, for an assembly operation using hand tools and manual methods, a low ranking on "Maintenance" would have little impact.
The questions lead to metrics for your Lean Manufacturing journey. Managers traditionally rely on accounting metrics. However, these are inadequate for Lean Manufacturing. Accounting data is the end result of a long chain of interrelated decisions, practices and events. And it usually has significant time delays. Managing a lean factory requires data that reflects what is happening upstream in these chains and in real time.
The assessment can also be a focal point for strategic discussions. It can organize and structure a strategic debate. It increases a company's ability to use facts and reduces the necessity to rely on opinion and, thus, tends to civilize the discussion as well.

Initial Profile
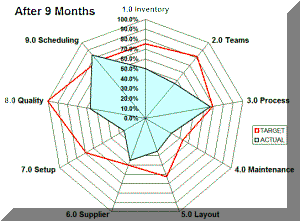
The company in this initial profile manufactured architectural windows. The blue profile shows their actual initial score prior to lean efforts. The red line indicates the strategic goal for each area. Gaps between actual and goal indicate the most serious deficiencies and lead to priorities.
■ ■ ■ ■ ■ ■ ■


