
Manufacturing Inventory Turnover Data
How Much Is Enough?
Benchmarking & Monitoring
For most manufacturers inventory is one of the top two items on the balance sheet. It often requires more capital than the facilities and equipment. Inventory is also a measure of overall efficacy since most manufacturing problems increase inventory.
One metric for evaluating the amount of your inventory is Inventory Turnover. Turnover measures the efficiency of inventory usage and compensates for differences in sales volume. This metric is simple, intuitive and easy to calculate.
Calculating Turnover
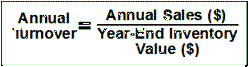
This calculation uses actual sales dollars from the P&L Statement and period-end inventory value from the balance sheet. It is also know as the Sales/Inventory Ratio. There are many variations of this calculation, for example:
The period need not be annual. Monthly or even weekly calculations may be useful.
Average inventory value over the period is more accurate than end-of-period value especially if there is seasonality. But an accurate average value may be unavailable.
Both sales and inventory value for the period should, ideally, use Cost of Goods (COG). However, This information may be unavailable. Moreover, manufacturers vary widely in their calculation of COG and this makes comparison between companies less accurate.
Turnover can monitor trends or changes from previous periods. It is also useful for benchmarking against similar firms. When benchmarking with industry averages there are several cautionary notes:
There are wide variations in turnover even within an industry or industry sub-group. The best firms may have turnovers that are 200%-900% of the industry average. Targeting the industry average turnover is setting up mediocrity as a goal.
There MAY be special circumstances that dictate an average or below average turnover. However, such circumstances can often be overcome. When low turnover occurs, it is important to find and rectify the source of high inventory.
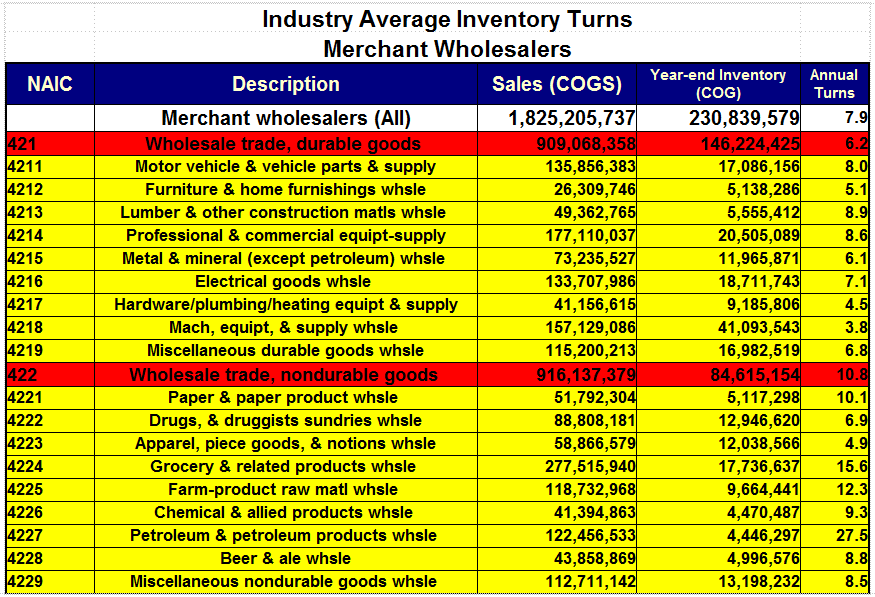
Benchmark averages for major industry groups are shown below on the sample worksheet. Turnover ranges from a low of 6.2 (Leather, 316) to a high of 16.7 (Petroleum, 324). A few of the subcategories also appear in this example. We offer a much more detailed spreadsheet with over 750 categories and sub-categories for only $8.00. Click Here to purchase. The raw data comes from the U.S. Census Bureau's 2007 Economic Census Report.
Inventory Distribution
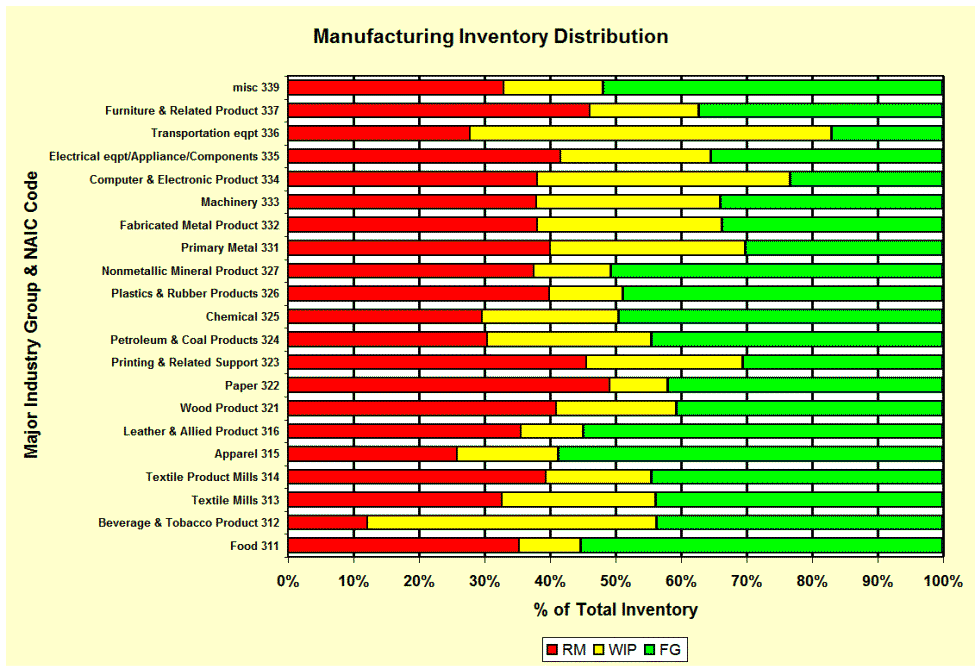
The proportions of inventory in Raw Materials, work-In-Process (WIP) and finished Goods can indicate problems to be addressed in various areas. Higher than normal proportions in Raw Materials indicates supply chain opportunities. Causes may include long lead times, transportation, quantity discounts, supplier selection, poor scheduling or poor inventory accuracy. Higher than normal proportions in WIP indicates problems on the manufacturing floor. Examples of causes might be poor workflow, functional layouts, scheduling or quality problems. Abnormally high Finished Goods inventories can indicate a disconnect between manufacturing output and customer's needs. Causes of the disconnect might be batching, long setups, long throughput times or erratic demand. The chart below shows how inventory is distributed, on average, within major industry groups. More detailed information on 4, 5 and 6 digit industry groups is available in the spreadsheet.
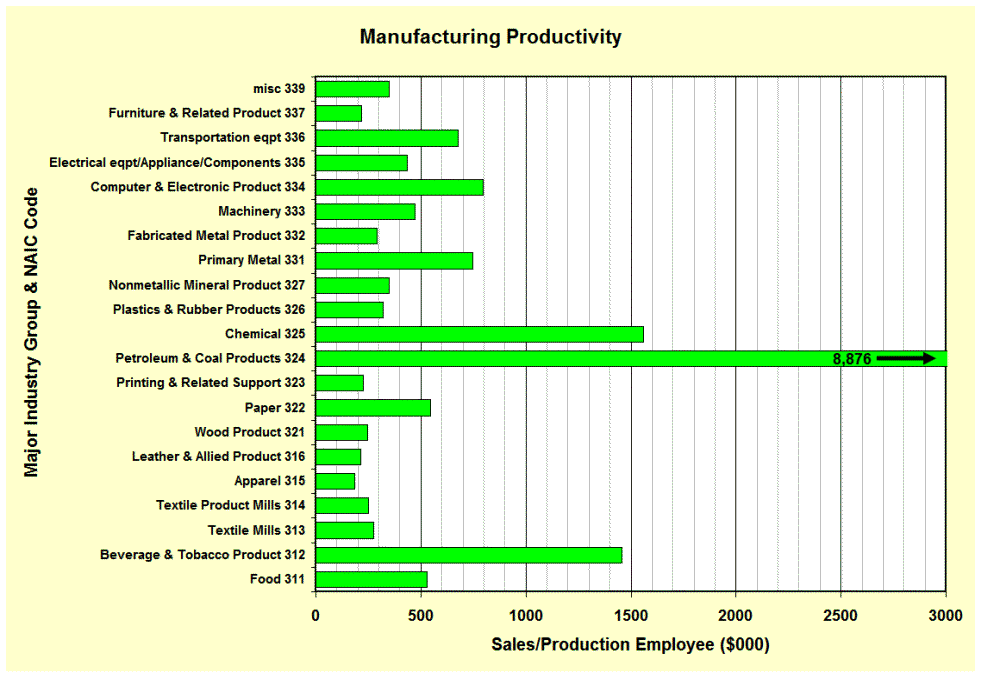
Manufacturing Productivity
Sales per Employee is one of many metrics for benchmarking productivity. When comparing across firms, even within the same industry group, most productivity measures are very approximate and sales-per-employee is no exception.
This particular study focused on inventory rather than productivity. However, we have included this particular metric in our database because it was convenient and may be useful to some users.
Benchmarking & Monitoring
For most wholesalers and distributors, inventory and the space to store it is the largest single cost of doing business. From purely a cost viewpoint, less inventory means less cost. At the same time, insufficient inventory can lead to stockouts, lost sales and unhappy customers. Balancing these two factors is critical to profitability and growth but achieving that balance is not obvious or easy.
One metric for evaluating the amount of your inventory is Inventory Turnover. Turnover measures the efficiency of inventory usage and compensates for differences in sales volume. This metric is simple, intuitive and easy to calculate. Both sales and inventory value are measured in terms of Cost of Goods:
Turnover can monitor trends or changes from previous periods. It is also useful for benchmarking against similar firms. When benchmarking with industry averages there are several cautionary notes:
1) There are wide variations in turnover even within an industry or industry sub-group. The best firms may have turnovers that are 200%-400% of the industry average. Targeting the industry average turnover is setting up mediocrity as a goal.
2) There MAY be special circumstances that dictate an average or below average turnover. However, such circumstances can often be overcome. When low turnover occurs, it is important to find and rectify the source of high inventory.
Summary data for wholesale industry turnover averages are shown at right. We offer a much more detailed spreadsheet with over 260 categories and sub-categories for only $8.00. Click Here to purchase.
Strategos Can Help To...
Design or improve your warehouse layout and operations for maximum efficiency.
Reduce inventory required and space required for its storage.
Improve customer response.
Reduce stockouts.
The Process Starts With...
- A preliminary discussion that scopes the size and complexity of the problem.
- A project discussion will follow in several days to, jointly, outline the scope of a project that meets your needs and estimate preliminary costs. We will then send a proposal.
- If you accept the proposal, we begin data acquisition and, together, execute the project.

■ ■ ■ ■ ■ ■ ■

|
The Strategos Guide To Value Stream and Process Mapping goes beyond symbols and arrows. In over 163 pages it tells the reader how to do it and what to do with it. |
The free newsletter of Lean strategy