TQM, Six Sigma & Lean; Do The Shareholders Benefit?
The answer is YES, But...
The TQM Debate
TQM has been criticized for not bringing benefits to shareholders through increased stock price performance. For example, in recent years, several companies recognized for outstanding TQM efforts fell on hard times even when the economy boomed. At least one author has declared TQM "Dead as a pet rock."The participants in this debate have generally used little evidence, anecdotal evidence or questionable evidence. However, an empirical study is now available.
Professors Kevin B. Hendricks and Vinod R. Singhal studied 3000 firms that use TQM effectively. They compared the TQM firms to control groups of similar companies without formal TQM. The TQM firms fared significantly better in, profitability, Return on Assets and stock performance.
On the downside, these conclusions depend on effective implementation (often problematic). In addition, the benefits may take 3-5 years to develop.
Extrapolation of Results
The findings of this study apply directly to Six Sigma. Six Sigma is not significantly different than TQM aside from the colored belts and other fashion accessories. This is the opinion of Joseph Juran as well as myself and the authors of this study.
At Strategos, we believe that Lean Manufacturing provides equal or better results than TQM and achieve them sooner in many situations. Lean Manufacturing overlaps TQM significantly and TQM is a major component of most lean initiatives. In addition, the team development and problem-solving skills of TQM enhance other Lean elements.
The TQM orientation may eventually lead to the same results as lean manufacturing. But, TQM starts with quality which may or may not be the most critical area or the area that produces quickest results. For example, a recent client of ours started on the Lean Journey and realized quickly that kanban could reduce finished goods stocks by $3-5 million. It required only minor changes and no investment. They immediately started implementing. The benefits of a one-time cash flow started immediately and continued for 8-12 months.
Conclusions
- TQM benefits flow to the bottom line and significantly affect financial measures and stock price.
- It takes a long time- perhaps 3-5 years.
- Six Sigma produces similar results
- Lean Manufacturing should produce similar but quicker results.
- Smaller firms benefit more.
- Highly focused firms benefit more.
- Low capital firms benefit more.
- The benefits depend on effective implementation.
(Move Cursor To Enlarge Graphs Below)
Average Stock Price Increase vs. Benchmarks
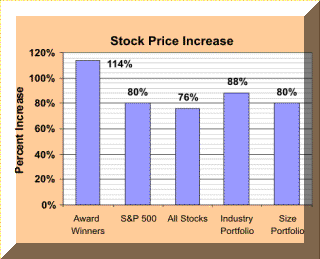
Comparison of the stock price performance of award winners and various benchmark portfolios. The results depict the changes in performance over the five-year post-implementation period that starts one year prior and ends four years after the date of winners winning their first quality award.
The results indicate that award winners significantly outperformed the benchmark portfolios. The stock prices of award winners increased by an average of 114% over the five-year period. Over this same time period an alternative strategy of investing a similar amount in S and P 500 Index and holding it over the same time period would have resulted in an 80% return. The difference of 34% is a statistically and economically significant level of outperformance - it translates to an average market value creation of an extra $669 million. The chances of observing the difference of 34% purely by luck is about 1 out of 150.
Average Stock Price Increase Over Time
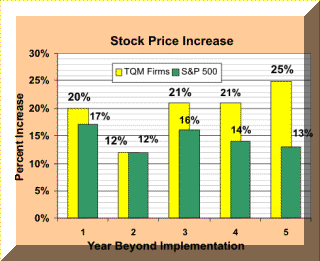
Comparison of the stock price performance of award winners and the S and P 500 on an annual basis. The results depict the annual changes in performance over the five-year post-implementation period that starts one year prior and ends four years after the date of winners winning their first quality award.
this figure compares the stock price performance of the award winners against the S and P 500 Index on an annual basis for each of the five years in the post implementation period. The award winners beat the S and P 500 Index in four out of the five years, with most of outperformance occurring from the third year onwards. Award winners beat the S and P 500 in the third year by 5%, fourth year by 7%, and in the fifth year by 12%.
Since award winners are likely to have an effective TQM implementation a year before they win their first quality award, the pattern of annual stock price performance of Figure 3 suggests that it might take a couple of years after effective implementation before the benefits of TQM begin to show up in the form of higher stock returns. Organizations should view TQM as a long-term investment and must allow time for its benefits to show up in financial performance.
Operating Performance- All Firms
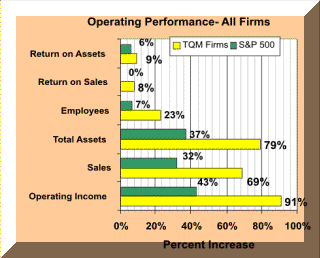
This figure depicts the profit, growth, and efficiency performance of award winners during the post implementation period. The differences are striking. Operating income for award winners increased by an average of 91% over the post-implementation period. This is in contrast to an average 43% increase over the same time period for the benchmark firms. The difference of 48% is a statistically and economically significant. The chances of observing this purely by luck is about 0.5%
Award winners also experienced higher growth. Winners increased sales by 69% compared to 32% for the benchmarks, increased total assets by 79% (compared to 37% for the benchmarks), and increased the number of employees by 23% (compared to 7%. Winners also showed higher improvement in efficiency measures. The return on sales improved by 8% compared to no improvement for the benchmarks, and the return on assets improved by 9% compared to 6% for the benchmarks. These results clearly indicate that TQM does improve profitability, leads to higher growth, and improves efficiency. The improvement in profitability is the reason for the rise in stock prices of the award winners.
Independent versus Customer Award Type
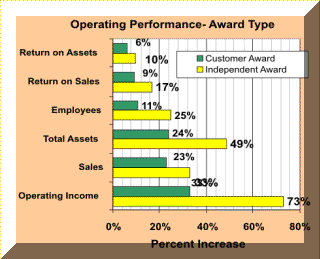
There are dramatic differences among firms that won independent awards such as the national and state quality awards, and those winning customer awards such as those given by Chrysler, Ford, and Texas Instruments, among others. The national and state awards have more comprehensive and stringent evaluation criteria, and use a multi-stage evaluation process conducted by independent third-party examiners. Thus, winning independent awards could indicate more mature TQM implementations when compared to the maturity of implementations at firms that have only won awards from their customers.
The figure supports this conjecture. In operating income independent award winners outperformed benchmarks by an average of 73% whereas customer award winners outperformed benchmarks by 33%. Independent award winners do better than customer award winners on sales (39% vs. 23% increase), on return on sales (19% vs. 9% increase), and return of assets (10% vs. 6% increase). Independent award winners also outperformed the S+P 500 by 51% compared to the 26% outperformance of S+P 500 by customer award winners.
Although independent award winners do better, all winners do better than their corresponding benchmarks on all performance measures.
Average Stock Price Increase Over Time
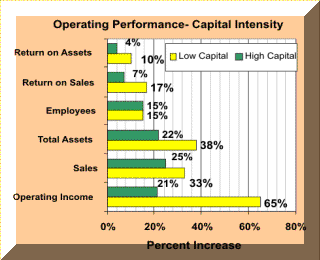
An important component of TQM is adopting practices such as employee training, involvement and empowerment, and information sharing. Employees are the driving force for improvements originating from activities such as suggestion programs, quality circles, cross functional teams, and process improvement teams. Clearly, the opportunities for gains from these activities are likely to be higher in a less capital-intensive environment than in a more capital-intensive environment.
This figure shows that low capital-intensive award winners do better than high capital-intensive award winners on all performance variables except growth in employees. For example, in terms of improvement in operating income low capital-intensive winners outperformed their benchmarks by an average of 65% and high capital-intensive winners outperformed their benchmarks by 21%. Low capital-intensive award winners do better than high capital intensive winners on sales (33% vs. 25% increase), on return on sales (17% vs. 7% increase), and return of assets (10% vs. 4% increase). The figure indicates that both low and high capital-intensive winners gain from effective TQM implementations as both these segments outperform their respective benchmarks.
Operating Performance by Size
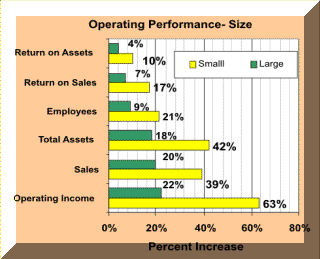
This figure compares the performance of smaller and larger award winners. The median total asset value of the sample, $600 million, is used to segment the sample. Winners with total assets asset below the median are considered small, and winners with assets greater than the median are considered large. The performance numbers show that both the smaller and larger award winners gain from effective TQM implementations - both these segments outperform their respective benchmarks. The figure also shows that smaller winners generally fared better than larger winners. Smaller winners experienced a 63% improvement in operating income (compared to 22%), a 39% increase in sales (compared to 20%), and a 17% improvement in return on sales (compared to 7%).
The observation that smaller winners did better than larger winners is not that surprising considering the fact that many key elements of TQM such as teamwork, worker empowerment, and spirit of co-operation across functional departments are already present to some extent in smaller firms. Additionally bringing change can be more difficult in larger firms. Clearly, the results do not support the conventional wisdom that TQM is less beneficial to smaller firms.
Operating Performance by Focus
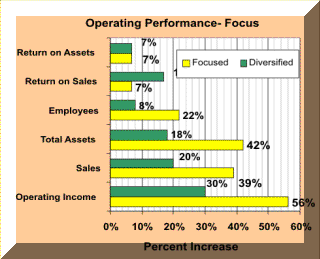
Focused firms are likely to benefit more from TQM than diversified firms because the different operating units in a more focused firm are likely to be very similar in terms of organizational culture, technology, operating procedures, and competitive priorities. Therefore, the lessons learned from a successful TQM implementation in one operating unit can easily be implemented in other operating units. As operating units gain experience with TQM, the knowledge created in the process can be transferred at low cost to other units. Such economies of scale and learning synergies may not be present to the same extent in more diversified firms. This figure supports the conjecture.
Focused award winners do better than diversified award winners on all performance variables except efficiency measures such as return on sales and return on assets. Focused winners experienced a 56% improvement in operating income (compared to 30%), a 39% increase in sales (compared to 20%), and a 7% improvement in return on sales (compared to 17%). However the figure does show that both focused and diversified award winners gain as both segments outperform their respective benchmarks.
■ ■ ■ ■ ■ ■ ■

