
Inventory Speaks!
What You Can Learn From Inventory Analysis
At Strategos, we find Inventory Analysis useful for a wide range of projects. From Facility Planning and Plant Layout to Process Improvement to Customer Service, inventory has a story to tell. This paper takes an operational rather than financial perspective, e.g., building product, serving customers, filling orders, providing facilities. In this paper we show examples of projects where inventory analysis had a major role.
Inventory reflects shortcomings in the system; it covers up problems. Inventory records contain information that, properly interpreted, can lead to improvements in many manufacturing and distribution processes.
The data required for an inventory analysis is often readily available. It requires only formatting, visualization and interpretation. Every analysis is different, however, in some respects. A degree of experience and intuition helps immensely. Skills with spreadsheets and database managers are also necessary for a good analysis.
Inventory speaks! It has a story to tell. Is anyone listening?
Why Inventory Matters
|
Typical Annual Carrying Costs (Table1) |
|
|
Storage & Handling |
4%-9% |
|
Insurance & Taxes |
1%-4% |
|
Obsolescence |
2%-5% |
|
Theft & Damage |
1%-4% |
|
Cost of Money |
10%-15% |
|
Total Range |
18%-37% |
Ultimately, the only reason for holding inventory is to have work-product available when and where machines, people or customers want it. Here are some examples for illustration:
Home Depot stocks a particular item in the store so that when a customer arrives the item is immediately available. The customer is unwilling to wait for the item and unable to order the item in advance of his/her need. Therefore, it must be in inventory or the sale is lost. Moreover, Home Depot will stock the same item in several nearby stores because the customer is unwilling to travel to that nearby store. Further, the arrival time for customers wanting the particular item is unknown and unpredictable. Hence, the need for Finished Goods inventory.
A stock of a particular component is stored in an assembly operation so that when the assembly line needs the part for a particular product, it is readily available. The stock is necessary because it requires time to order and deliver the part and that order-delivery time is unpredictable. In addition, the need for the part is unpredictable since the assembly line schedule changes weekly. Thus the need for Purchased Parts (PP) stock.
A stock of large machined castings is held after machining and prior to cleaning and deburr. The deburr department is working on a large batch of a different product and is not yet ready to start work on these other castings. It is difficult to schedule the upstream production so that it arrives at deburr exactly when deburr is ready for it. Thus, a queue of jobs is held as WIP inventory.
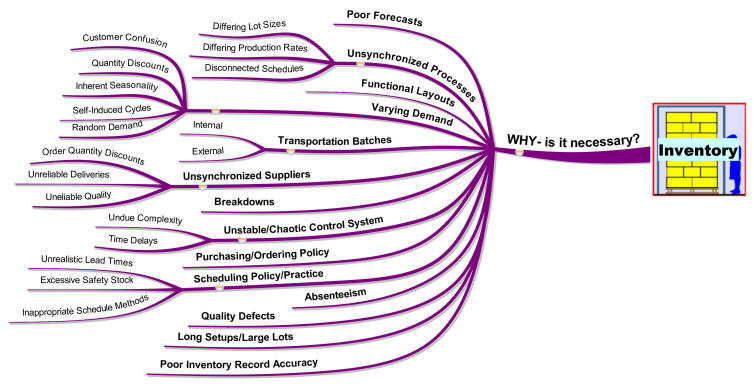
Figure 1 Causes of Inventory
Capital Investment
Inventory devours capital. It is usually the largest or second largest “asset” on the balance sheet and often exceeds the investment in facilities and equipment.
Carrying Cost
Few companies are aware of their true carrying cost, the total annual cost for holding their inventory. This is different from the cost of the inventory itself. The cost of the inventory is a one-time capital investment. Carrying cost recurs annually. Table 1 shows the typical ranges of carrying costs as a percent of the inventory value.
Space
Inventory requires space in a warehouse or on the shop floor. This space is costly. It either has been purchased with capital funds or leased with operating funds. It is not unusual to find 50% of a factory used for inventory storage or the aisles to move the material. When new products and processes are under consideration, inventory reduction can create useful space.
Inventory As a Consequence
 Eiji
Toyoda is credited with the idea that inventory is the result of deficiencies in the manufacturing system and tends to hide those deficiencies. According to legend,
Toyoda once asked his lieutenants, “Why do we have inventory?” When they responded with a plethora of reasons, his comment was “Very good, now would you
please eliminate those reasons.”
Eiji
Toyoda is credited with the idea that inventory is the result of deficiencies in the manufacturing system and tends to hide those deficiencies. According to legend,
Toyoda once asked his lieutenants, “Why do we have inventory?” When they responded with a plethora of reasons, his comment was “Very good, now would you
please eliminate those reasons.”

Some of the many causes of inventory are in figure 1. There are probably many more such causes. Figure 1 illustrates the pervasive nature of the inventory issue and why it is so intractable. Almost any difficulty, anywhere in the organization can, eventually, increase inventory. Moreover, the causal chain is often obscure.
There is more discussion of these reasons and the causal chains in our article“Inventory—Why All the Fuss?” A later article will explore these reasons and the causal chains in more detail.
Footprints in the Sand
The various causes of inventory leave a trail in the inventory records. Like footprints in the sand, these records provide clues or hints to the main causes and, thus, to solutions. In most cases, these causes are problems that have created negative effects that are far more serious than a bit of excess inventory. However, these other negative effects have not left a sufficient trail—they are long forgotten and obscured. Like the trail of footprints, inventory records will not definitively prove or even identify the original problems. Rather, they point the way to further investigation. This is what Inventory Analysis is about.
Inventory Metrics
What To Measure & How To Measure It
Dollars or Units?
The most fundamental measure of inventory is Units of Measure (U/M). This may be pieces, gallons, pounds, lineal feet or other unit and varies from SKU to SKU. U/M is most useful for the operational perspective or when examining a particular SKU.
In general, SKUs cannot be aggregated using units of measure unless they are all very similar. For the most part, SKUs are not interchangeable as production components or as items sold to a customer. When analyzing stockouts or history, the individual SKU is important and we often use U/M.
From a financial perspective, the funds invested in inventory are the primary interest. Item-by-item information is less important and there is a need to aggregate all items or various classes of items such as Finished Goods (FG), Work-In-Process (WIP) and Purchased Parts or Raw Materials (PP/RM). To do so, the value of each item is multiplied by the number of items. The sum of various items measures the total inventory in a particular class. Table 2 illustrates.
Turnover
The total dollar amount for an item or class of items can be deceptive. Fast moving items may require a larger number on-hand to satisfy customer demand than slow-moving items. Turnover incorporates sales or demand to adjust for this fact.
This is the most common form of the equation. There are many variations. For our purposes, the variations make little difference as long as there is consistency.
One modification is to use average rather than year-end inventory. This is appropriate where seasonality exists and year-end inventory does not give a true picture. However, year-end inventory is easy to obtain from the balance sheets and average inventory may not be available. Another modification is to use different time periods, say, monthly or weekly. This is useful to identify short-term cycles or medium-term trends.
For distribution and warehouse operations, sales is usually expressed as Cost-of-Goods-sold (COGS) and inventory value as Cost-of-Goods (COG). This is the preferred method. However, there are different inventory valuation methods and the available data may dictate some other valuation.
For manufacturing, the calculation of COG varies between companies. Moreover, the presence of significant Work-In-Process further complicates the situation. For manufacturing, we often substitute sales income as the sales figure rather than COG. This introduces another variable (Gross Margin) but assures consistency. The sales data is usually more available than COG.
Level of Accuracy
Overall inventory measurements and analyses discussed here rarely require high accuracy for operational purposes. The problems that inventory points to tend to be major (although hidden) problems and small differences in valuation, turnover, TEI or inventory value do not affect major conclusions.
This is not the same as Inventory Record Accuracy, the measure of how many individual records match the physical inventory in count and location. Inventory Record Accuracy (IRA) is very important to operations and does require high accuracy.
Figure 2 Turn-Earn Index Example
Turn-Earn Index (TEI)
When all SKUs have the same gross margin, turnover is the only measure of inventory efficiency necessary. However, margins may differ between items. When this is the case, the Turn-Earn Index (TEI) helps account for this added variable.
TEI = Turnover X Gross margin (%)
Equation 2 Turn-Earn Index
Slow-moving items have a bad reputation. In reality, they can be a profitable and an important part of the product mix under the following conditions:
-
Slow movers are necessary to fill out a product line.
-
They do not crowd out fast movers.
-
Margins are high enough to justify their storage costs.
The TEI helps to identify those slow-movers that do not meet these conditions. Items with low turns and low margins show a low TEI. Items with slow movement but high margins show a respectable TEI. Items with high turnover and low margins also show a respectable TEI. Generally, the TEI should be above 120.
Figure 2 shows both turnover and TEI for the inventory example of Table 2. Examining turnover for the second SKU (A-67324), a turnover of 9.2 would generally be considered as adequate although it does not compare favorably with SKU #5 with a turnover of 25.7. However, SKU #2 has a high margin that gives it a TEI of 460 that is extremely good.
In contrast, SKU #5 (X-45556) shows a very good turnover of 25. However, the margin is low on this SKU and the TEI is about half of SKU #2’s TEI. Still, a TEI of 260 is quite good. The remaining three SKUs have both a low TEI and low turnover. Here, both the margins and the stock level should get scrutiny. Questions to ask are:
-
Can stock levels be lowered?
-
Is the margin adequate to cover the cost of storage?
-
Other good reasons (e.g. filling out product line) to maintain these items?
This article has discussed some of the lessons to be learned from "the voice of inventory." For more detail on how to analyze inventory in an operational setting and learn to interpret what this voice is saying, see our article on "Inventory Analysis."
■ ■ ■ ■ ■ ■ ■
|
The Strategos Guide To Value Stream and Process Mapping goes beyond symbols and arrows. In over 163 pages it tells the reader how to do it and what to do with it. |
The free newsletter of Lean strategy