Designing The Kanban System
More than A Guess; Less Than A Science
Designing The Kanban System
Preparing for a Kanban scheduling system can be formal with elaborate analyses and simulations. It can also be very informal with fine-tuning done on the production floor. Process Mapping can help understand the underlying process and Value Stream Mapping uses Kanban in many places.We suggest the following Ten Steps for Kanban Design:
1. Analyze Product-Volume For Upstream Work Center/
2. Analyze Downstream Order Patterns
3. Identify Kanban Products
4. Identify Appropriate Lot Sizes
5. Identify Containers
6. Identify Signal Mechanism
7. Specify Stockpoint(s)
8. Specify Initial Kanban Quantities
9. Develop Upstream Scheduling Algorithm
10. Operate Fine tune

Kanban Stockpoint
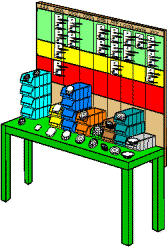
This figure shows how a stockpoint might look for nine types of small parts using tote boxes for containers.
Daily Operations
In the best systems, operators or teams schedule their own work. They have current and accurate information of downstream production needs. The scheduling bucket is rarely larger than a day. In some systems, it may be only minutes.
Operators examine returning kanban cards or signals to determine where stock is low or high. Aids such as boards with red, yellow and green zones can assist. Knowing the most favorable sequence for changeovers, the operator first schedules items in the red zones. Products in the yellow and green zones then follow.
Operators might also have a list of incoming orders. With this, they identify any unusually large order(s) that will overwhelm the stock.
How Many Kanban?
The number of cards or containers is a key issue. Excess cards and inventory encourage sloppy scheduling and a laissez-faire attitude. Insufficient cards adversely affects customers. Several methodologies can determine an optimum level:
Boundary Analysis
Predetermined Formula
Factor Analysis
Computer simulation
Trial & Error

Kanban Carts
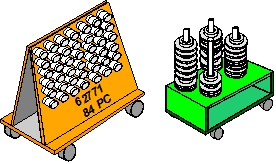
These carts serve as containers, transport devices and kanban signals. They limit the batch size by allowing only a certain number of part locations.
In Boundary Analysis, key people mentally step through system operation using Product-Volume and other data. With simplified methods and risk estimates, they put upper and lower limits on the stock.
Predetermined formulae are available. Such formulae usually contain "guess" factors and unavailable data. They often apply to specific situations and have limited usefulness.
Factor Analysis identifies the various factors that affect stocks. Examples are setup costs, order volatility, quality issues, stockouts consequences and gross volume.
Computer Simulation uses specialized software to build a model of the system. The analyst can vary parameters and arrive at desired levels. Simulation is expensive to do properly. Oversimplified simulations rarely show true operation, the role of human intelligence or effects of continuous improvement.
With Trial and Error, you set up the system and go. If it operates poorly, add more stock.If it operates too smoothly, take some away. At the ideal Kanban level the system operates "near the edge" and sometimes demands extraordinary measures. This business of "living on the edge" is important because it highlights problems that create erratic flow and encourages their solution.
■ ■ ■ ■ ■ ■ ■


