
Ten Steps to Kanban Design
Steps 1-4
The Ten Steps
We like to think in terms of ten basic steps to analyze and design kanban systems and these steps are summarized here. For many, perhaps most, systems the steps do not require as much detail, formality and rigor shown in the examples; many times an educated guess is quite adequate. But, the educated part of the guess requires that you know what you are trying to do in that step and why it is important.
Most kanban systems are easy to change. So, a reasonable guess followed by monitoring and fine tuning will result in a near-optimum system with reasonable effort. When the system may be difficult to modify, a more rigorous analysis is in order. Another reason for informality is that accurate data may be unavailable.

Analyze Products-Volumes for Upstream Work Center
Upstream work centers may produce multiple products, often for several downstream workcenters. Some of these items may be unsuitable for kanban and this will become clearer with the Product-Volume analysis. This is also the time to ensure that the upstream work center has adequate capacity to produce this product mix and volume.

Analyze Downstream Demand Patterns
The purpose of the Stockpoint is to buffer any differences between downstream demand and the ability of the upstream workcenter to precisely track that demand. If the upstream workcenter can track downstream demand exactly, there is no reason for the kanban system and direct link (a.k.a. FIFO) or a broadcast system is more appropriate for coordinating the two workcenters. The greater the disparity between downstream demand and upstream ability to supply it, the larger the kanban stock.
To examine this downstream demand, prepare a short-term demand chart as shown in Figure 4. Normally this will be a daily demand chart but it might be hourly, weekly or some other period. Figure 4 shows that, for this example, the daily demand over a five-month period exceeds upstream capacity on only six days. Later, we must decide whether to provide enough stock to cover these particular occurrences or cope with them in some other way.
Overall capacity, however, is only one factor that affects the upstream workcenter’s ability to track demand. Setup times, lot sizes and downtime are also considerations. It may also be necessary to examine demand on an item-by item basis.

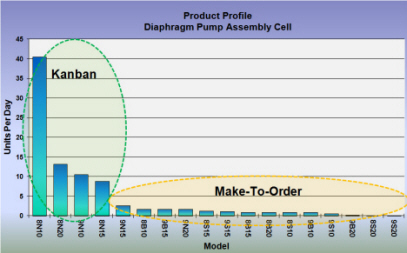
 Identify Kanban Products
In Step 3, identify those products suitable for kanban. For this example, Figure 3 shows that of the 18 products, only four have enough volume to justify a kanban stock. The remaining twelve will be made to order. It is assumed that the general pattern demand for individual items reflects the overall demand and this may not be the case. For example, Item #9S10 might be sold in a different market that orders in very large lots but these orders are few and far between. Such a pattern does not fit well with kanban and would require a large kanban stock that is used only rarely even though the total volume appears to be mid-range.

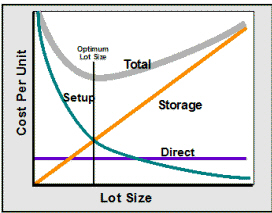
Identify Appropriate Lot Sizes
Lot sizes are important for both the upstream and downstream workcenters. Generally, the smaller the lot sizes, the smaller the kanban stock and the better the system works. Small downstream lots smooth demand on the upstream workcenter. Small upstream lots enable that workcenter to better track downstream demand.
Contrary to some assertions, Economic Lot Size analysis is still relevant (Figure 5). We can make it irrelevant through SMED techniques that reduce setup time and cost. But, until setup cost is near zero, building in lots will likely be necessary. Until we can build in lots of one, kanban stock is necessary and the amount of that stock is determined partly by lot sizes.
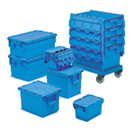
 Identify Containers
Containers are not always used in kanban systems but they offer many advantages, especially for small items. Containers can:
- Protect Contents
- Make Handling & Storage Easier
- Make Quantities Readily Apparent
- Control Maximum Inventories
- Serve As Kanban Signal
Some guidelines for container selection:
- Equal to or Smaller Than Upstream Batch Size
- Equal to or Smaller Than ½ Total Kanban Quantity
- May Be Much Smaller Than In Conventional Operations


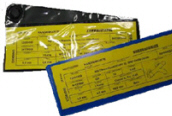
Identify Signal Mechanism
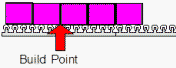
There are many possibilities for the signaling system that informs the upstream workcenter of stock status and withdrawals. One of the best is a simple visual signal, as in Figure 2 where the upstream operator simply glances at the actual Stockpoint. This is enhanced by large labels and color codes. It is even better when both the upstream and downstream operators are in line-of-sight with the Stockpoint.
However, it is not always feasible to have both workcenters adjacent to the Stockpoint. In such cases some sort of remote signal is required such as cards, lights, or empty containers. The most important characteristics are simplicity and speed. Complex systems are difficult to learn, sometimes get forgotten and may not attract attention when unusual situations arise. Computer reports and emails, for example, may not be looked at as frequently as necessary. Here are some examples of Kanban signal systems:
- Kanban Cards
- Empty, Returned Containers
- Empty Racks Or Storage Units
- Empty Storage Location On Floor
- Lights With Remote Switches
- Daily Fax Sent To Supplier
- Markings on a Conveyor
- Verbal Request


Specify Initial Kanban Quantities
Determining the best quantity for the amount of Kanban stock is seldom an exact process. In designing the system we, of course, must make at least an educated guess, estimate or assumption. Following startup, the system should be constantly monitored and the kanban quantity adjusted. The difficulty arises because there are so many variables, so much variation and so little data in most practical situations. Moreover, the optimum quantity will change as operators and managers improve the system. These variables may include:
- Product Mix Changes
- Demand Changes
- Schedule Interference
- Transport Time Variation
- Raw Material Availability
- Equipment Breakdowns
- Quality Problems
- Operator Training
- Work Time Variation
With all that said, there are some approaches that can help with estimating the initial Kanban quantities. In a particular situation, the designer may use several of these methods in combination.
This is one of the most important features of kanban; it uses the production control system to drive continuous improvement. In some firms, the authorized stock level is intentionally and gradually reduced to expose problems and improve processes.
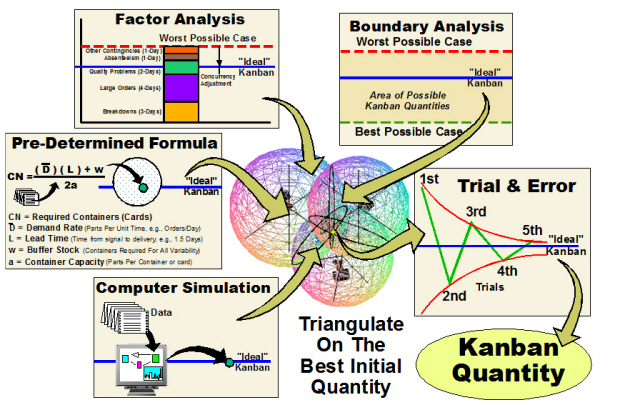
Boundary Analysis
In this approach we attempt to focus first on the minimum necessary stock if everything is running smoothly or normally. This sets a lower bound on the stock level. Then we focus on the worst reasonable situation where many sources of variability are active and set an upper bound on the stock level. We can compare these boundaries to the stock levels generated by other methods as a sort of sanity check.
Factor Analysis
In Factor Analysis, we attempt to isolate particular factors that give rise to variability and the need for a buffer stock. The list above is a good start but hardly complete. Considering only one factor at a time, we estimate the buffer required to cope with the variability from that factor. Then we add the various buffer requirements. Since it is highly improbable that all factors will come together and act at the same time, we adjust the result. This, too, is only structured guesswork but that may be better than unstructured guesswork.
Predetermined Formula
Several formulae for calculating quantities have been published. Figure 8 is one example. This is one method for approximating the quantity and may be useful as one of several starting points. However, the formulae usually contain one or more terms that are guesses or they may apply to a particular company and some particular type of process.
In Figure 8, the term “w” is buffer stock that must account for all the variability mentioned earlier. In addition, the Demand Rate is an estimate, at best, and the Lead Time (L) is likely to be highly variable unless the upstream workcenter is dedicated to the particular product or a narrow product family.
Trial & Error
While the methods mentioned above may provide an initial estimate of quantities, ultimately, trial and error is the final test. This simply involves monitoring the stock level over a period of time, usually several weeks or months. If the stock has never or rarely dropped below a certain level, all the stock below that level is excess and unnecessary. So, we remove all or most of it and decrease the authorized kanban quantity.
If there have frequent stockouts or near-stockouts, it indicates that the stock may be insufficient. We might simply increase the stock level but a better approach is to investigate the stockouts, find the source of variability that created the stockout and remedy the problem
This is one of the most important features of kanban; it uses the production control system to drive continuous improvement. In some firms, the authorized stock level is intentionally and gradually reduced to expose problems and improve processes.
Computer Simulation
In theory, simulation would be the best approach. It accounts for the probabilistic nature and interactions of many of these factors. However, simulation requires a great deal of time, expensive software and special skills. In many situations there will be dozens or hundreds of different items and simulation is simply impractical. There may be situations where any change to the Kanban quantity is very difficult or expensive and simulation is worthwhile but such situations are somewhat rare.
■ ■ ■ ■ ■ ■ ■

|
The Strategos Guide To Value Stream and Process Mapping goes beyond symbols and arrows. In over 163 pages it tells the reader how to do it and what to do with it. |
The free newsletter of Lean strategy