
Apple and A U.S. Manufacturing Strategy
What Might Have Been for Apple
Overview
Previous sections of this article reviewed the Manufacturing Strategy employed by Apple at their 1984 Macintosh factory and contrasted it with the Manufacturing Strategy currently employed by Foxconn to build Apple's products. Steve Jobs once told President Obama that "Those jobs aren't coming back."
- But is that necessarily true?
- What might a well-thought-out manufacturing strategy look like for a U.S. factory?
- Would it be possible?
Steve Jobs' assertion will probably be true in actuality but it is possible to manufacture effectively in the US. Intel, for example, has demonstrated that U.S. electronic manufacturing can be viable. A USA Manufacturing Strategy, however, would be different than a China Manufacturing Strategy and certainly very different than Apple's 1984 Fremont non-strategy. This article describes a possible US manufacturing strategy that might be effective for Apple's products and markets.
Key Manufacturing Tasks
The Key Manufacturing Tasks along with Terry Hill's concept of "Order Winners" and "Qualifiers" flow from marketing strategy. The Key Manufacturing Tasks are the basis for subsequent strategic policies as outlined below. This is the critical link between marketing and manufacturing. As noted previously, Apple's Key Manufacturing Task is flexibility. For Apple, flexibility is required in three flavors—
- Volume Flexibility
- New Product Flexibility
- Product Mix Flexibility
Cost and quality are qualifiers. Apple need not have the lowest cost because they have premium pricing and high gross margins. Apple does not need the highest quality in the market, only sufficient quality to reassure potential customers that they will not be stuck with a lemon.
Manufacturing Strategy
The Workforce
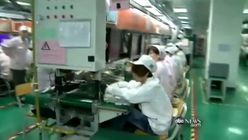
Lots of people, lots of supervisors, short-cycles, repetitive operations and simple conveyors are the most striking features at Foxconn.
A US factory would not have the vast reserves of inexpensive labor found in China. However, when properly deployed, the American workforce has significant advantages and differences. Here are some key points:
Stability– The majority of Foxconn's workers come from China's Western provinces. They contract to work for a year. After that year they often return to their family or attempt to find other jobs in the large eastern cities. In the U.S., workers are more likely to be settled and seek work near their home. They are likely to be more mature and more stable in their employment.
Skills & Experience– Foxconn's Chinese workers are literate but generally inexperienced in industrial operations and technical skills. Their life in Western China has been centered on primitive agriculture. American workers, in contrast, have grown up with technology in all its forms and would be more comfortable with it.
Motivation– For Chinese workers, the poverty in their home villages, lack of a social safety net and few employment opportunities means that their primary motivation is money— for themselves and their families. Most are at the physiological level in Maslow's Hierarchy of Needs. In contrast, American workers would have few concerns about physiological needs or personal safety. Their motivations will be a mix of social, esteem and self-fulfillment. This will require differnet compensation, organization structure and plant layout.
Supervision
The Ford-style production lines employed at Foxconn require a lot of supervision. Observation of various scenes in the videos indicates about one supervisor for every four workers. A similar assembly line with more mature and stable American workers would require less than half that number of supervisors. Cellular Manufacturing should require even less, perhaps one supervisor for every 15-25 workers.
Note: Steve's numbers are suspect— they are very large and very round. In 2008 the entire U.S. automotive industry, including suppliers only employed 880,000 people. this may be an example of Jobs' well-known "reality distortion field."
Industrial Engineering
Steve Jobs once stated that 700,000 people were employed on Apple products and 30,000 were engineering technicians. That equates to an I.E. Technician for every 22 workers. This is a very high ratio, necessitated by the unstable workforce and the production line arrangement. A factory making similar products in the U.S. would probably have about one IE Technician for every 50 workers.
A Cellular operation requires far less engineering support because the workers are trained to perform these engineering and problem-solving tasks. A cellular operation in the U.S. would probably need about one IE Technician for every 200 workers.
The accompanying table shows estimates of the headcount required for three possible scenarios—1) Production Line Factory in China (Foxconn), 2) Similar Production Line Factory in U.S., and 3) Well Executed Cellular Production in U.S.
Since Mr. Jobs' figures may not be accurate, the chart starts with an assumed 1000 line workers and is then based on percentages. So, for every 1000 line workers in Foxconn's factory, a similar factory in the U.S. would probably require about 700. The reduction comes primarily from rational automation of tasks as discussed later. A U.S. Factory employing cellular production would probably require about 500 workers. This reduction comes from eliminating micro line imbalances and from improved motivation.
Total Labor Cost
Comparing labor cost is difficult because of the differences in fringe benefits, wage structures and because of the complexity of exchange rates and taxes. Foxconn workers probably have a base pay of about $2.50 an hour and workers for a U.S. factory would probably be paid, say, $15.00 per hour. Even a reduction in labor hours of 58% would not make a U.S. factory competitive on wages. But, it helps and labor is often only 5%-10% of total cost. GE, for example, is moving some appliance production back from China to Kentucky because of reduced wages for newer workers. Presumably their analysis shows it more profitable to build appliances in Kentucky even with $18.00/hour wages.
Workforce Summary
The differences in workforce background and motivation call for different approaches in several respects. A U.S. factory for Apple would emphasize:
- Hiring of mature, stable, socialized and teachable workers.
- Investment in training and education for workers.
- Team-based organization and work groups.
- Workflow arrangements on the plant floor that encourage teamwork.
- Incorporation of many supervisory, quality and technical support functions into the work teams.
- Compensation that emphasizes longevity and team performance.
|
Headcount for Various Scenarios
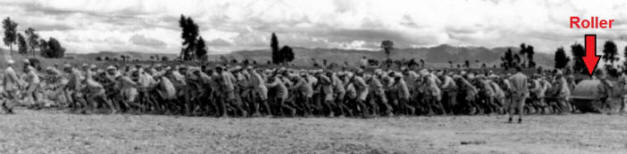
Hundreds of chinese workers pull a roller. They are building a runway for B-29 bombers during world War II. This willingness to work hard at manual tasks persists to this day in China. But, it is starting to change as prosperity flows from the Eastern cities to other parts of China. |
Coming Next—
Our next installment will discuss other issues of a U.S. Manufacturing Strategy for Apple. These issues include plant layout, quality, supply chain and focused factories. All of these aspects are related to each other as well as to the workforce.
References
Platzer, Michaela D. and Harrison, Glennon J., "The U.S. Automotive Industry: National and State Trends in Manufacturing Employment" (2009). Federal Publications. Paper 666. http://digitalcommons.ilr.cornell.edu/key_workplace/666
Economix Editors, "The iEconomy: How Much Do Foxconn Workers Make?", The New York Times, February 24, 2012 .
Uchitelle, Louis, "Factory Jobs Gain, But Wages Retreat, New York Times, Business Day, May 5, 2012
![]()
■ ■ ■ ■ ■ ■ ■

|
The Strategos Guide To Value Stream and Process Mapping goes beyond symbols and arrows. In over 163 pages it tells the reader how to do it and what to do with it. |
The free newsletter of Lean strategy