Reducing Inventory Errors
NOT The Usual Suspects
An Ounce of Prevention...
Reducing the input error rate is one of the best ways to improve accuracy, but few firms do it well. All the more strange because the tools and procedures are simple old stand-bys from A3, Work Simplification and TQM: fishbone diagrams, process charts, pareto charts, five why's and teams.
In some firms, Root Cause Analysis consists of finding someone to blame. Real root causes are usually systemic; not personal.
Root Causes of Inventory Record Errors
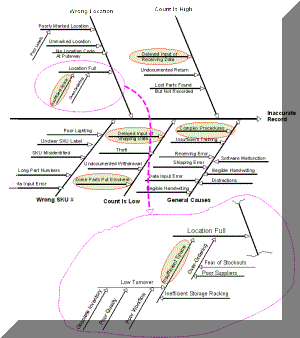
The fishbone diagram of figure 5 (a.k.a. Ishikawa chart, cause & effect chart), shows some common inventory errors and their possible causes. The red envelopes highlight some of the more prevalent and overlooked causes of errors. Dashed purple lines illustrate how any branch can be expanded, digging further and further towards the real root cause.
This is not a complete summary of causes; nor does it drill down to all root causes. It is, however, a good starting point.

"Major Strasser has been shot...
Round up the usual suspects!"
■ ■ ■ ■ ■ ■ ■


