
Mixed Model Production
The What, Why & How

Introduction
Mixed Model Production is the practice of assembling several distinct models of a product on the same assembly line without changeovers and then sequencing those models in a way that smoothes the demand for upstream components.
The objective is to smooth demand on upstream workcenters, manufacturing cells or suppliers and thereby reduce inventory, eliminate changeovers, improve kanban operation. It also eliminates difficult assembly line changeovers.
To illustrate conventional assembly practice, consider the three products shown in figure 1. Note that the upper components are physically different and assume they are built at three separate workcenters. Demand shown in figure 2 is perfectly stable, uniform and predictable.
Figure 1 A Stable Product Mix
Figure 2 Daily Customer Demand
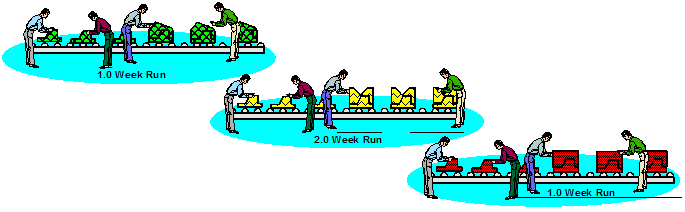
Figure 3 Conventional Assembly Line Practice
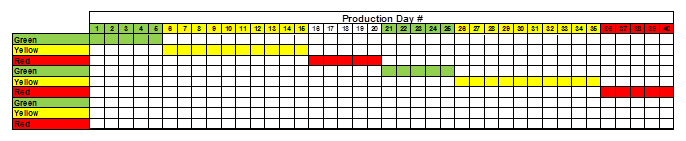
Figure 4 Gantt Chart for Conventional Assembly Line Practice
Conventional Assembly Line Practice
Figures 3 and 4 illustrate the conventional assembly line practice as developed by Henry Ford and Charles Sorensen. A single product moves along a conveyor and at each station, workers assemble various items. The entire line changes to a different product on a fixed schedule and then assembles this product for a scheduled period before changing to the next product.
On large assembly lines, setup is often problematic. Parts are brought in for a new job and remaining parts taken away for the just-completed job. Such lines often need re-balancing with different stations and task assignments. Then, there is the initial startup as everyone gets accustomed to the new configuration. If parts do not fit, or cannot be found, there is more disturbance. When, at last, the line is humming, nobody wants to disturb it with another changeover. Such is the case with our hypothetical assembly line.
And so, once setup, the line runs for a week on the first product, 1-GRN. At the end of a week, 40 units are complete even though the customers only need 10 units. The remaining 30 units must go into inventory to carry the customer demand for the next three weeks. The figures below illustrate.
After another frenetic changeover to product 2-YEL, the line runs for 2.0 weeks since the demand for this part is higher. Eighty units are built. Twenty of these units supply customer demand during the run. The remaining 60 go into inventory.
Another changeover and, for a week, the line runs 3-RED. Forty units are made. Ten for customers and the remaining 30 for inventory.
Figure 4 shows the schedule for eight weeks of production. The first week produces the Green product at 8.0 units per day. Since the demand for Yellow is twice that of Green, Yellow is made for two weeks. Red is built for one week. This cycle then repeats continuously.
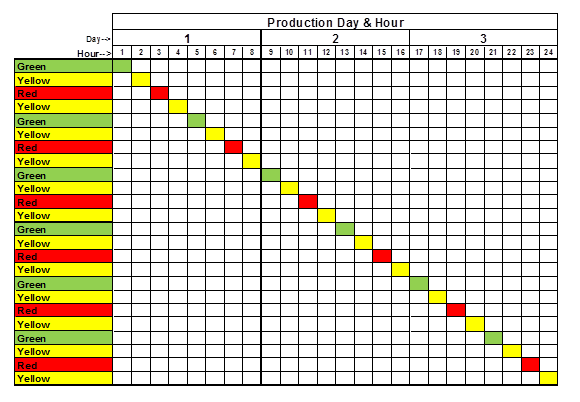
Figure 6 Gantt Chart for Mixed Model Assembly Line Practice
Mixed Model Assembly Line Practice
With mixed model assembly, figure 4, multiple models are interspersed on the same assembly line. The ratio of each model to total output is consistent with customer demand. Thus, in figure 4, there are two “Yellows” for every “Green” and two “Yellows” for every “Red”. These are the same ratios shown in figure 2.
The Gantt chart of figure 6 shows how this looks with respect to time and corresponds to the chart of figure 4. Figure 4 shows hourly production but for only three days. In this case, every model coming down the line is different from the model that precedes it.
Mixed model assembly, at first glance, seems overly complicated. It presents difficulties in part stocking, setup, skills, training and general confusion
that must be overcome.
However, if we can address these difficulties, there are major benefits both upstream and downstream in the process. Benefits come from the effects of mixed
model assembly on:
- Upstream Demand Variability
- Upstream Capacity
- Upstream Inventory
- Space Requirements
- Changeover Time
- Scheduling

■ ■ ■ ■ ■ ■ ■

|
The Strategos Guide To Value Stream and Process Mapping goes beyond symbols and arrows. In over 163 pages it tells the reader how to do it and what to do with it. |
The free newsletter of Lean strategy