Facilitating A Process Charting or Value Stream Mapping Team
The Facilitator's Role
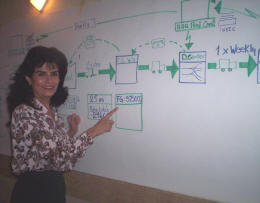
Lourdes Menendez
Facilitating Value Stream Mapping for Strategos in Puebla, Mexico.
While mapping is useful for individual thinking, it is most effective in a group setting. In a group, the facilitator is key.
Facilitators guide events, question conventional wisdom and keep the discussion on track. The team provides detailed process knowledge.
Teams do not need training in mapping techniques if the facilitator has charting and mapping experience. Gilbreth's method and symbols are so simple and intuitive that the team learns quickly from the facilitator's example.
Facilitators need not have experience with the process under study. Indeed, lack of experience can be an asset; it forces questions that others take for granted. However, facilitators do need experience with group mapping.
Preparation
1. Identify management objectives
Discuss the problems, products and process with management and identify their objectives.
2. Select a preliminary product
In many situations, problems involve a broad class of products that may have different processes or routings. Try to determine if the solutions for one product will apply to the entire class. If not, separate charts may be required for several sub-classes.
Select a product that is fairly typical or representative, not the most complex; not the simplest. A brief walk through the plant will also help. As facilitator, you do not need to know the details of the process at this point. Only a general knowledge of the types of processes and their physical arrangement is necessary.
3. Prepare the room
Other than provisions for drawing the map, the normal requirements for a meeting room apply.
Process maps can become quite large. They should be on a single piece of paper that everyone can see and read. This may require covering one or more entire walls, from floor to a 7' height, with paper. Computers are not helpful here. They only display a small part of the map, the drawing technique is clumsy and they distract from the mapping.
After the session, rearrange and transfer the chart to another sheet or a computerized program. If you use a computer, plot the chart on a single large sheet. Breaking it into 8-1/2"X11" sheets loses visual impact.
Chart The Present State
1. Open The Meeting
Start with the usual introductions and state the objectives. It is unnecessary to explain the charting techniques or symbols in detail. The team will learn by doing.
Tell the group that they will be "charting the sequence of events that affect the product." Explain that they should put themselves in the place of the product and ask "What is being done to me."
2. Select The Product
Discuss product selection with the group and get agreement on a specific product or part number. Have them imagine a very specific item even down to the color and serial number. This is important.
Charting a group or family, rather than a single product, introduces complexity and disagreement. Even a very similar family is likely to have differences in the process. It is much easier to map a single part number and then reconcile differences for other parts.
When items are batched, have the group imagine a particular item somewhere in the middle of the batch. It helps to have a sample of the product.
3. Determine the Boundaries
Process maps are most useful at the micro or macro level. First, have the team describe the process in very general terms and obtain their overview. From this, suggest a starting boundary.
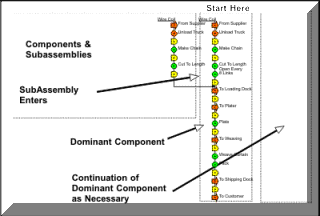
Process Chart Layout
While it is difficult to predict the final dimensions and form of any given chart, a bit of pre-planning helps.
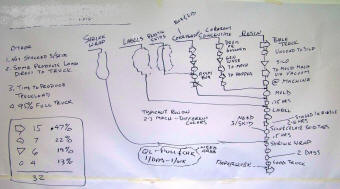
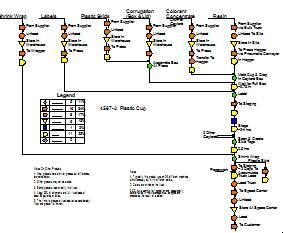
Drawing the Process Chart
When documenting the process during a session, speed is essential to keep participants focused and alert. Neatness and detail can come later. Here is an example as it was recorded during the charting session and the final document as transferred and refined later.
4. Chart The Process
Identify Major Components
Ask some general questions about the materials and components. It is unnecessary to list all components at this time. As each component joins the product, use a horizontal arrow and label it. Later you will start at the beginning for each component and join that part of the chart with this arrow.
|
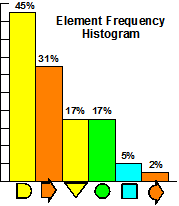
Element Frequency |
The dominant component is the item with the most events. People generally select this from their general knowledge. It should turn out that some other component actually dominates the process, the chart can be rearranged later.
Document The Events
Draw the first symbol, explaining it as you draw. For example: "Let's start where the material crosses the property line. Does it come in a truck? (Yes)." "This arrow represents a Transport event."Question closely about events between value added steps. The team often neglects moves and delays in the beginning. As the chart progresses they will grasp the idea and begin to identify all events.
5. Summing It Up
Have the group count elements and prepare an element frequency histogram. Counting the events is a simple and effective measure of waste.
It also helps to create an "Ideal State" Map that contains only the value-added processes. This helps people conceptualize what the process could be and develop a practical compromise.
Ask for comments on the process and tell the group to think about this process and set a time to re-convene and determine ways to improve it.
Design The Future State
|
Brainstorming is a creativity enhancement technique that uses group dynamics. The Columbo approach is also know as "The 5 Ws" or "The Questioning Attitude." It asks a series of questions designed to stimulate thinking. When the team is stuck, either or both of these methods, directed at specific elements, are helpful. Using them formally for every element of the process, however, is time-consuming, frustrating and unnecessary. One or two days between the present state mapping and the future state mapping allows time for gestation, and improves creativity. Likewise, if the team becomes stuck, a break can often help. Non-Value Added EventsA facilitator should normally address the non-value added events first. These have usually been ignored for years, there are many of them and they may be surprisingly easy and inexpensive to eliminate. ►Moves and DelaysMoves and delays are likely to constitute the largest category of NVA elements. Point out that these are related. Moves usually have a delay waiting for the move and a delay after the move before the next event. Batching also produces delays. The usual remedy for moves and delays is to move workstations together, often in a workcell. Sometimes process events can be combined as when a machinist performs deburr during the next machine cycle. If batching cannot be eliminated, smaller batches produce shorter delays. If moves cannot be eliminated, smaller more frequent moves produce shorter delays. ►InspectionInspections are also problematic. In some cases they are simply unnecessary. In others, an inspector does inspections that operators could easily do as part of the process. When product must wait for an official inspector, there is, inevitably, a batch and delay. ►HandlingHandling events are infrequent but often easy to eliminate. They usually appear when batches of mixed product are sorted. It is often possible to maintain segregation of the product originally and eliminate the sorting. ►StorageStorage may occur infrequently but storage and carrying cost is usually high. Moreover, accounting systems often do not capture the true storage cost. Some storages disappear when operations are brought together. In other situations, the amount of storage can be reduced by more frequent delivery or kanban. Value Added EventsValue added events such as turning, casting, soldering and assembly have usually been studied closely. Accounting and management systems focus on them. Moreover, they often require new equipment, extensive investigation and changes involving engineering, quality or other departments. For the above reasons, a team usually addresses such changes in a second phase after improving the NVA events. When it is necessary to examine value added processes, this often arises from a need for multiple, smaller-scale processes for workcells. Quality issues may also force an early examination of the value added events. Finally, some improvements to value added processes can be made quickly and cheaply and these should not be ignored. Leverage PointsAs facilitator, look for leverage points. These are events that, if changed lead to very large improvements or untangle a complex situation. Leverage points are often accepted as inevitable and unchangeable. They may be the conventional wisdom. As a facilitator, you have a unique position to question and provoke new thinking. Facilitation Procedure►Focus on Value Added EventsAsk for additional ideas on the value added events in a formal or informal brainstorming session. Have the group classify them by whether or not they could be implemented quickly. Identify value added events that have large improvement opportunities. Such events May:
►Get consensusOnce the various potential improvements are identified, lead the group towards consensus on the following questions:
►Develop an Action PlanHelp the group develop their action plan. This may include additional meetings or a different implementation team. |
■ ■ ■ ■ ■ ■ ■

 Brainstorming
and the Columbo approach are the two basic methods for streamlining a process. The facilitator
generally combines these informally and directs the group's attention to the most opportune
areas. This requires considerable experience and instinct about where those opportunities may
lie.

