Manufacturing Focus—A Comprehensive View
Production Modes & Degrees of Focus
Production Modes
Production mode is the fundamental arrangement and method for manufacture. Fixed location, job shop and mass production were early versions. Plant layout writers
of the 1950s recognized the connection with plant layout and referred to it as “layout style.”
Production mode is characterized by several key features:
- Physical arrangement
- Focus
- Product flow
- Pattern of resource flow
- Task sequence
- Task cycle
- Task repetition
- Task balance
- Task synchronization
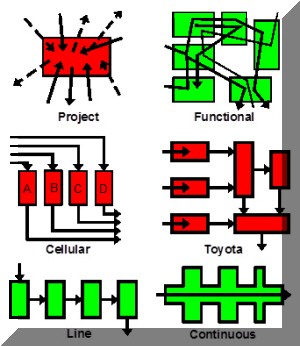
While many combinations of key features are possible, only a few have practical consistency. Within a facility, however, several modes may exist simultaneously in separate areas. The usual modes are project, functional, Toyota, cellular, line and continuous. The modes and their characteristic features are illustrated in Fig. 15.1, and the flow characteristics in Fig. 15.2.
- 1. Project mode is usually associated with a fixed position layout. The product is completed or essentially completed in one location. Products are usually large, e.g. a building or a ship. Resources are brought to the one point and the product is immobile or relatively so.
- 2. Functional modes are characterized by groupings of functional specialties. Similar machines and equipment form a functional department. Materials move from one functional area to another. The result is a complex material movement pattern. Labor typically possesses one functional skill, with operators concentrating on their own efficiency. This and inter-functional moves retard material velocity.
- 3. Cellular modes have work cells processing families of parts. In a group technology cell, a small number of work locations each have a primary group of operators. The emphasis is on group effort and individuals may move with the work piece from machine to machine through the cell. Machine utilization is not emphasized. Small batch sizes and quick throughput are the benefits. The flow patterns may be straight through, L or U-shaped.
- 4. The Toyota system incorporates linked cells with minimum in-process inventory and a pull system of material flow control. Just-in-time inventory, Kanban production control, total quality concepts, scientific maintenance and Vendor families are considered part of the Toyota system.
- 5. The line or Detroit method is a sequenced flow pattern with fixed work stations and short cycle operations linked by a moving line. Material is delivered to the beginning of the line or to work stations in batches. Products are completed by the time they arrive at the end of the line. Flow line work is characterized by high-volume, repetitive, short-cycle work.
- 6. Continuous flow patterns have few system entry points. Materials flow through a linked sequence of unit processes with fixed means of transfer. The process operates continuously, products are homogeneous, the system is saturated and volumes are high. Oil refineries and steel mills are examples.
Flow patterns become less complex with cellular, Toyota, line and continuous plant configurations. Material velocity increases with movement away from a functional layout. This has important implications for the material handling designer.
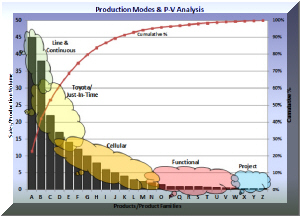
Figure 15.3 is typical of many product—volume profiles. On this chart, each bar represents a product or group of highly similar products. The vertical axis represents production volume. This chart overlays the typical range of application of each mode on the P-V plot. With few products and high volume, continuous and line production are normal. At the opposite extreme, high variety and low volume suggests project or functional production.
Degrees of Focus
Only line and continuous production can achieve pure product focus. Only the functional mode can achieve a pure process focus. Cellular and Toyota modes are intermediate. Line and continuous modes can be intermediate between product and process focus when they produce more than one product. The project mode is a special case which fits neither the product nor the process category.
There are many ways to mix focus. Parts and materials may move through a process focused machine shop, for example. Product focused assembly lines might then perform final assembly. In Table 15.1, the advantages and disadvantages of product and process focus are illustrated.
Figure 1 Production Modes & Characteristics
Product Focus
Advantages
- Simplified cost control
- Greater cooperation across functional disciplines
- More responsive purchasing and support services
- Flatter organization structure
- Greater accountability and responsibility lower in the plant
- Simpler plant controls
- Faster product velocity through greater inventory turn, hence, reduced cost
- Simplified and more focused quality improvement efforts
- Used in situations with lower 'economies of scale'
- More responsive to customer needs
- Overall overhead typically reduced
- More amenable to being managed as a profit centre
Disadvantages
- Some duplication of key management positions
- Potential for lower machine utilization
- Traditional managers are often uncomfortable with this focus
- Sometimes has trouble handling very different new products
- Shop floor 'monuments' must still be shared
Process Focus
Advantages
- Traditional managers comfortable with this approach
- Ability to share scarce resources and increase utilization
- Typically used in industries like chemical processing
- Suited to situations with a heterogeneous labour force Usually, the units are cost centres
Disadvantages
- Increased friction between functional managers
- Higher control costs and increased probability of error
- Product costing difficult
- Effective quality improvement efforts are more difficult
- Difficult to downsize
- In practice, process focus is usually less flexible than a product focus
■ ■ ■ ■ ■ ■ ■


