
Experience Curves In Manufacturing
Learning in Industry Sectors

Learning & Experience Curve Synopsis
- For each doubling of total volume or repitition, cost, labor and other inputs decline by a fixed percentage.
- Many factors, including management attention, determine the specific "learning rate".
- The concept applies across a wide range of activities and organizations from individuals to entire industries.
- The reductions are consistent over long time periods of years or decades.
- At the level of workcells and workstations future cost declines are predictable.
- Athe level of Companies and industries there are important implications for Marketing and Manufacturing Strategy.
The Experience Curve
Experience Curves are an expansion of the Learning Curve idea from individual and group learning to factories, companies or entire industry sectors. Companies can use Experience Curves to develop marketing and manufacturing strategy. Experience Curves are usually established over longer time periods than Learning Curves. In addition, market price is often used as a substitute for actual cost since costs for such a wide-ranging study are often unavailable. Experience curves are similar in behavior and are often represented by the same formula as Learning Curves. But, there are some differences.
The cost improvements are often the result of macro-level changes in systems, technologies and culture rather than individual or small group experience.
Improvements from individuals and work groups certainly can contribute when widespread and accumulated over time.
These differences between Learning and Experience curves result in differences in their use and application. Experience curves apply to Manufacturing, Marketing and Business strategy. This contrasts with Learning Curves which are most useful for tactical applications such as evaluating work group performance or estimating product cost.
The concept was first proposed by Bruce HENDERSON of the Boston Consulting Group (BCG). Figures show some results of BCG's research. Here are some key points:
The steady decline with each doubling of cumulative volume is remarkably consistent and continues over very long timeframes.
The phenomenon appears in a wide range of industries and products.
While early studies implied that there was no end to the cost declines, various factors surely place limits on the decline. If a thing cannot go on forever, it won't.
The dog-leg shape for Kitchen Ranges and PVC Resin is apparently caused by the substitution of market price for actual cost. It is likely that the large companies in these industries maintained their pricing even while their costs were decreasing in order to derive higher profits.
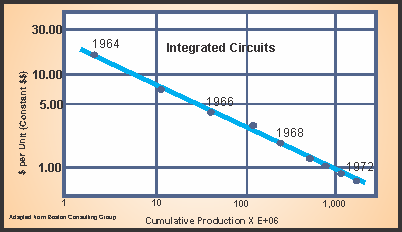
Fig 1-Experience Curve for Integrated Circuits
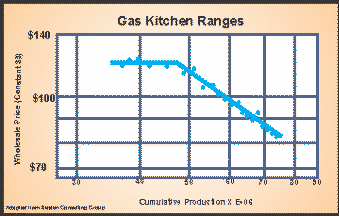
Fig 2-Experience Curve for Kitchen Ranges
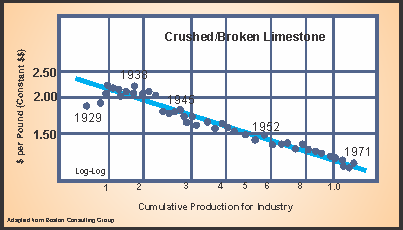
Fig 3-Experience Curve for Crushed Limestone
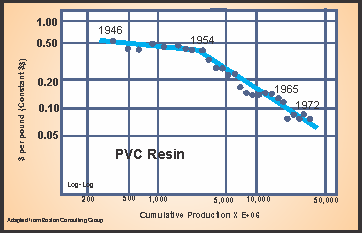
Fig 4-Experience Curve for PVC Resin
Experience Curve Characteristics
Typical Experience Curve Slopes
The slopes of Experience Curves tend to range from 60% to 90% with an average of about 85%. This is the conclusion of GHEMAWAT from a compilation of 97 academic studies. It is also the range generally seen in the literature. Learning slopes also vary by industry and process type. The distribution of Ghemawat's study is in figure 5.
Competitive Effects of Improved Learning
Two firms, "A" and "B", have constant sales and constant market share but different learning rates. Figure 6 shows their cost performance over time. Note that the horizontal scale is in time units (quarters), not cumulative production.
Company "A" has a steeper slope where costs at each doubling are 80% of the previous costs. In nine fiscal quarter, Company A's cost advantage has gone from 62% to 79% over Company "B". This is true even though both companies have the same market share and the same production volume.
Company A's management has developed a culture of improvement and/or investment policies superior to Company B.
Market Share Effects
Much has been made about the effects of market share and the idea of building a long-term strategy on increased market share, increased learning and lower pricing. Our exploration of several models suggest that the slope of the learning curve is far more important than market share.
Figure 7 illustrates. Here, two firms, "A" and "B" have the same learning slope but firm A has three times the production and market share as firm B. With no change in market share for the next 10 quarters, the relative cost advantage remains constant even though cost for both firms is declining. After the tenth quarter, firm A increases market share, presumably by using its cost advantage to lower prices. At this point, the cost advantage of firm A widens but quickly stabilizes at a new point. Our model suggests that a difference in learning slope would have much greater effect than market share changes over any reasonable timespan.
Hover to Enlarge
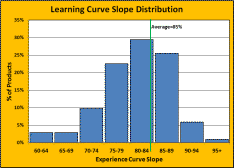
Fig 5 - Reported Learning Rates

Fig Fig 6- Reported Learning Rates
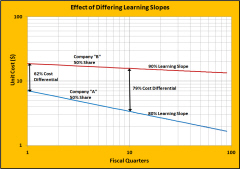
Fig 6- Companies with Differing Slopes
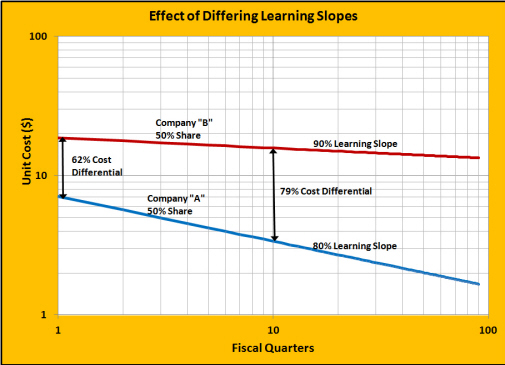
Fig 7- Companies with Differing Slopes
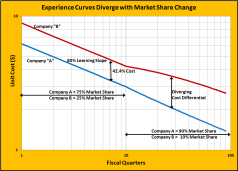
Fig 7- Market Share Effects
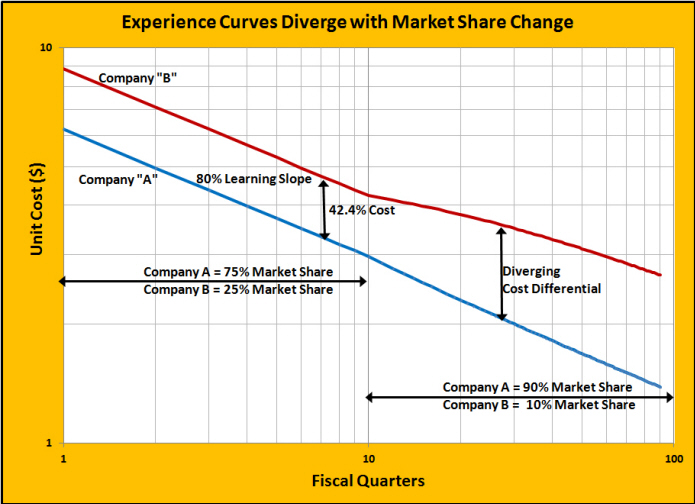
Fig 8- Market Share Effects

■ ■ ■ ■ ■ ■ ■

|
The Strategos Guide To Value Stream and Process Mapping goes beyond symbols and arrows. In over 163 pages it tells the reader how to do it and what to do with it. |
The free newsletter of Lean strategy