Transaction-Inventory Analysis For Warehouse Design
Based on NAVSUP Publication 529
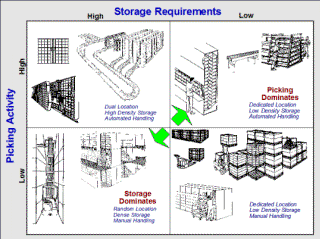
T-I analysis helps to choose between several possible combinations of storage method, storage height, handling and automation. NAVSUP 529 contains detailed design procedures and many pages of design data to assist this analyst.
The competing systems are ranked in order of increasing cost based upon a Transaction/ Inventory Ratio (T/I) for each height range. For a given T/I ratio, the least cost system for each height can be determined. These alternatives are then compared to determine the optimum height.
All labor costs are graphed in units of man-hours. Conversion to dollar cost can be accomplished at the prevailing local wage rate.
Vehicle costs are accounted for by two methods. In the case of wheeled vehicles (free path equipment), the vehicle count is independent of inventory. In these systems, vehicle cost is allocated on the basis of labor hours. The cost figure includes equipment cost and regular maintenance and operating costs averaging over 10 years at 2,000 hours a year.
In the case of captive equipment, such as the carousel and the S/R machines, the number of units is determined by inventory quantity and the number of aisles or storage units, in addition to the transaction rate. In these systems, the equipment purchase and operating cost is made an integral part of the storage equipment cost figure.
The storage structure and handling equipment function is one unit and cannot be separated. Vehicle count based upon transaction rate must be compared to the count based upon inventory. When the count based upon inventory is greater than the count based upon transactions, the total cost figure is then adjusted to lower costs by the amount of excess equipment.
Cost equations are developed in examples in the Guide. After the cost equations are developed, compute the Transaction/ Inventory (T/I) Ratios, which compare the two systems.
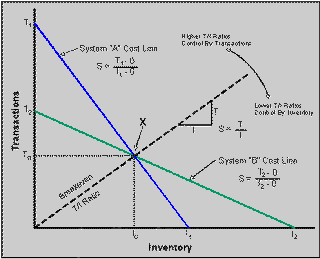
With differing costs for the transaction and inventory equations, compare the two systems and determine a level of inventory and transactions at which annual costs are equal. Higher values of T/I favor the system with lower transaction cost. Lower values of T/I favor the system with the lower inventory cost.
In making the comparison, a set of two equations with two unknowns is developed. If a value for either inventory or transactions is inserted, the other variable can be determined. This determines the T/I Ratio Line.
A T/I ratio greater than one is unusual, since this indicates that in one day all of the inventory rotates. Transactions will normally be a small percentage of the available storage locations.
Lines T1-I1 and T2-I2 represent cost equations of tow systems, A and B, through a range of transaction volumes and required inventory levels. The crossover point (X) represents the transaction and inventory values, To and lo that produce equality in the annual cost equations. The slope of the line passing through this point and the origin is represented by the T/I ratio of T0/10. Clockwise rotation of this line moves into a region of inventory control, where T decreases and I increases.
■ ■ ■ ■ ■ ■ ■


