
Normalization of Deviation
How Design Defects Become A-OK
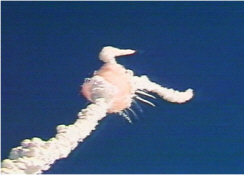
Figure 1 Space Shuttle Challenger Disaster
Space Shuttle Challenger
Why Did It Happen?
- Greedy Contractors?
- Overambitious Managers?
- Spineless Engineers?
- Incompetence?
Maybe, but author Diane Vaughan attributes it to a social phenomenon she calls "Normalization of Deviation."
- A3 Form (xls)
- A3 Problem Solving article (pdf)
- Normalization of Deviation article (pdf)
The Normalization of Deviation
Deviation in this context means departure from an expected, designed, normal or planned outcome. This is the very definition a "Problem" in most Problem Solving methodologies.
When organizations encounter such "Problems" they usually attempt to "fix" them. When fixes are unsuccessful, slowly over time, the organization may rationalize the problem by thinking of it as "normal" and, later, officially declaring it "normal." Once this happens, the issue is rarely addressed again.
The phenomenon is not due so much to individual incompetence or venality, it is more like Groupthink and, really, quite subtle. Participants and managers are usually unaware of what is happening until there is a disaster, either instantaneous as with Challenger, or a more usual slow-motion disaster.
What Happened at NASA
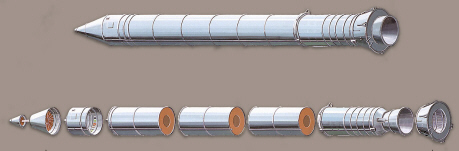
Figure 2 Solid Rocket Booster (SRB)
The two Solid Rocket Boosters (SRB) on the Space Shuttle were really just overgrown skyrockets as shown in figure 2. Because of their size, however, they were built in sections and assembled at the launch site. The immediate cause of the disaster was leakage of one of the joints between sections. Hot gas escaped from the SRB and ignited the adjacent fuel tank.
Figure 3 is a cross-section of the joints between sections. These joints were critical because they had to withstand tremendous heat and pressure from the internal combustion gas. They also had to withstand large mechanical forces.
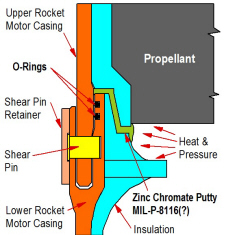
Figure 3 Joint Detail
The idea behind this joint was that the Zinc chromate Putty, in direct contact with combustion gas, would withstand high temperature. But the putty was viscous and would flow through the joint under pressure. The O-Rings could seal against pressure but could not withstand the heat of combustion gas. The O-rings were intended only to prevent the putty from flowing and the putty insulated the O-rings from the hot combustion gas.
When Challenger exploded on January 28, 1986, combustion gas had passed by or through the putty and destroyed the O-rings. This allowed large volumes of hot gas through the joint, opened a larger hole and ignited the adjacent fuel tank.
This joint design was deeply and fundamentally flawed from a structural perspective, a manufacturing perspective, a cost perspective (very expensive) as well as from a perspective on its ability to seal. We will not delve into those details here since our concern is with the organizational response to the problem rather than the technical problem itself.
 "...there’s
something drastically wrong when something that you think isn’t supposed to get any damage at all sustains that kind of damage, and you conclude it’s
okay.”
"...there’s
something drastically wrong when something that you think isn’t supposed to get any damage at all sustains that kind of damage, and you conclude it’s
okay.”
–Lawrence Mulloy, NASA
Based on the original design concept, the joint should have had ZERO LEAKAGE, ALWAYS. The O-Rings should NEVER experience damage from hot gas.
The first indication of joint problems occurred in September, 1977. Hydrostatic testing of the motor casing produced leakage in the joint and damage to the O-Rings, but not on every cycle. There was disagreement at this time about what conclusions should be drawn from these tests. Some participants interpreted the test results as proof that the joints were fundamentally flawed. Others thought the test demonstrated that the joints were OK because they only leaked after several cycles.
For more than eight years, through many flights and many more tests, the debate continued. More inconclusive data accumulated showing leakage and O-ring damage on apparently random occasions. Various "fixes" were attempted mostly involving the putty and other assembly procedures.
But a subtle shift in attitudes had taken place. The debate now revolved around the question of how much O-ring damage was acceptable. The original deviation (from zero leakage, zero damage) was now considered normal.
Indeed, during the debate on the evening before Challenger's flight, the issue discussed was about ambient temperature and how much additional leakage and damage low temperature might cause. Some engineers at Morton-Thiokol intuitively believed that the low temperatures were dangerous but were unable to make an effective argument.
Many other factors contributed to the Challenger disaster. One such factor was the unsuitability of O-rings for this application. Another was a lack of lateral rigidity that gave rise to the "joint rotation". These sorts of design errors are not unusual but they are usually exposed and corrected during testing.
The A3 Approach (What Might Have Been)
Had A3 skills been in place at NASA and/or at Morton-Thiokol, the structural and O-ring deficiencies would have been found and corrected early on. For example:
- An effective problem definition would probably have dismissed the idea that some leakage was acceptable. It would have prevented the Normalization of this deviation and maintained focus on the problem until it was truly resolved.
- A Cause & Effect diagram would have identified all of the possible causes, including the "joint rotation" that was not addressed until much later. This would have prevented the early, erroneous conclusion that the problem was in the putty.
- Root Cause Analysis would have instigated experiments, tests and analysis that would have identified the actual cause and pointed towards a solution even before the first flight.
- An organized search for solutions would have developed more robust joint designs that, while expensive, would have been far less expensive than a failure.
-
Even as late as the launch date, A3 problem solving skills would probably have helped the engineers, who suspected that low temperatures were dangerous, to better present their case.
(Click to Enlarge)
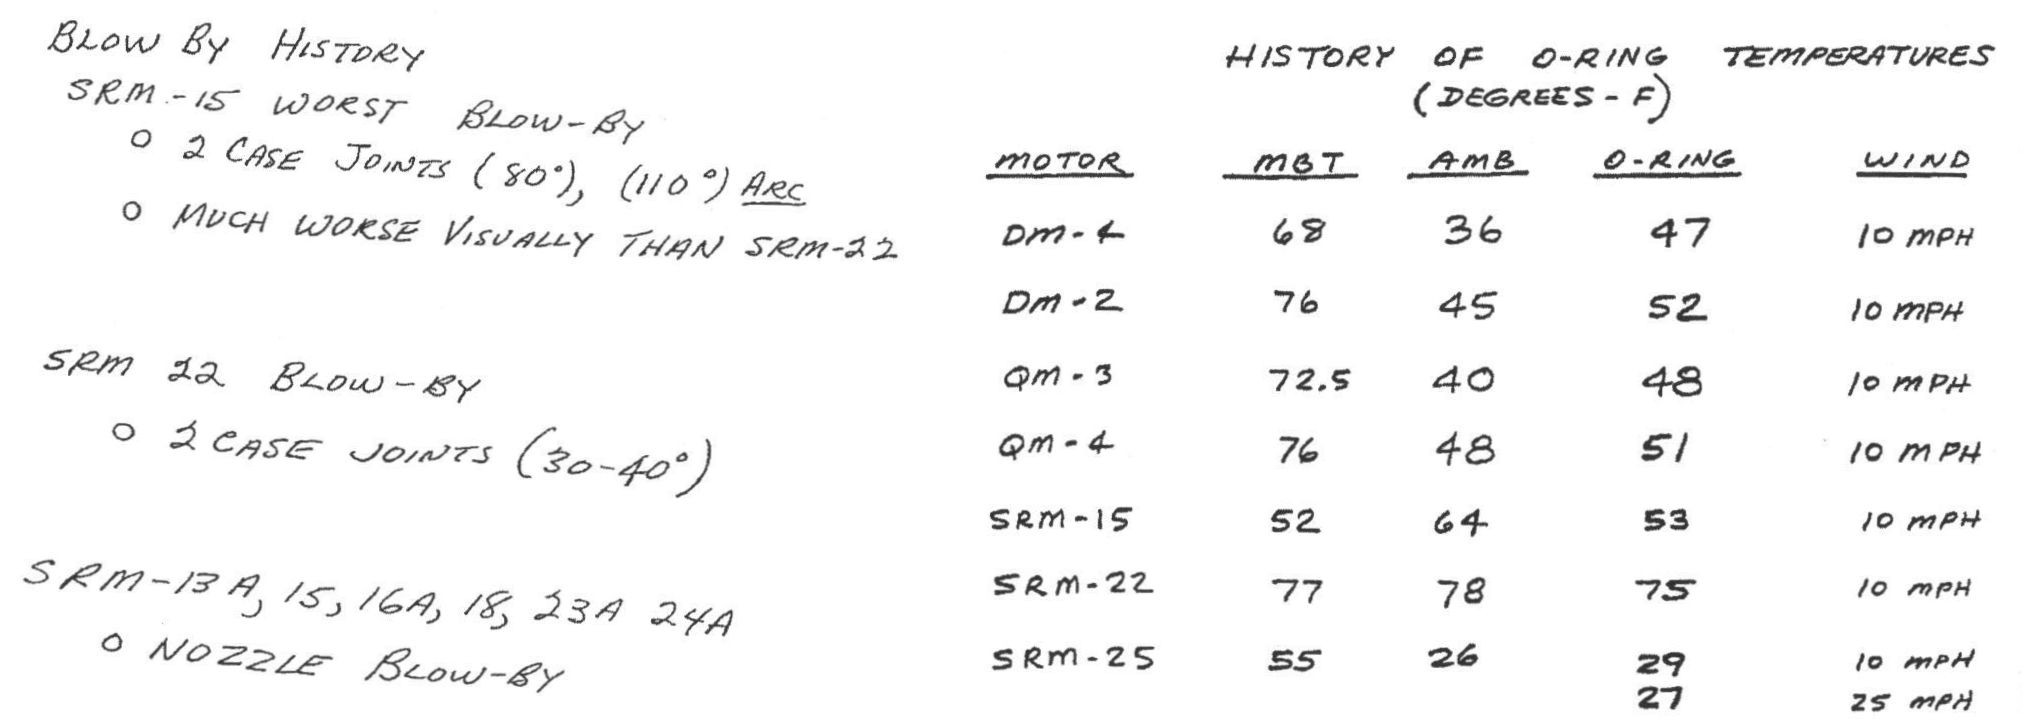 Figure 4 Pre-Launch Presentation
Figure 4 is typical of the thirteen documents that Thiokol engineers used during the pre-launch discussion. If you find it difficult to interpret, you are not alone. NASA and Thiokol managers also found it difficult. Moreover, Figure 4 excludes many important data points.
Figure 5 Pre-Launch Presentation
Figure 5 was presented to the Rogers Commission that later investigated the disaster. This was long after the event and there had been plenty of time to prepare an informative presentation. But the little rockets only added clutter and confusion. It is still difficult to make any sense of it. With A3 training the data would probably have been presented in a form similar to figure 6.
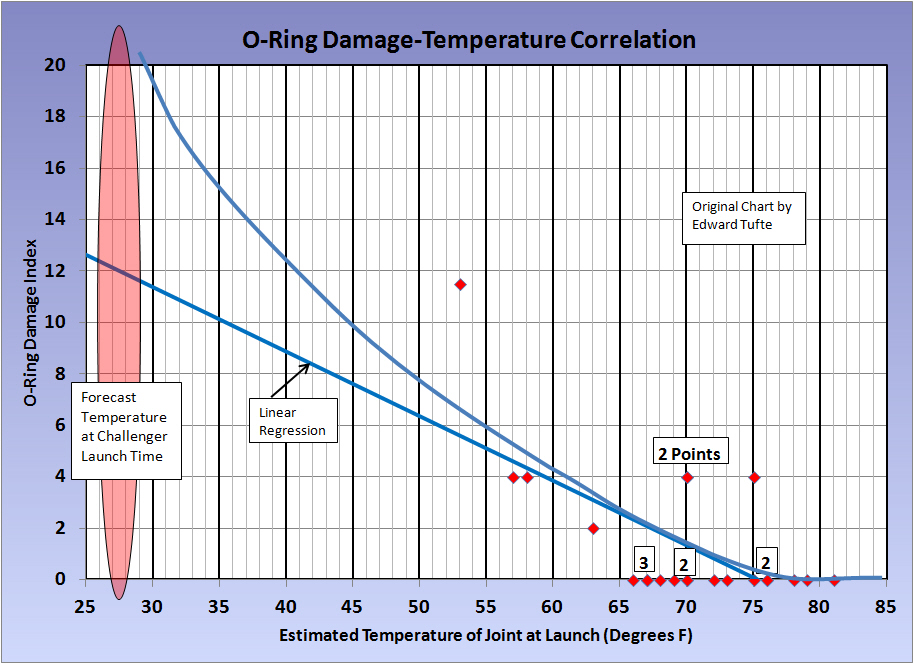
Figure 6 orders the data by the suspected causal variable and includes all data points. It is apparent that, although other factors are involved, the correlation with temperature is quite strong. This is especially true below 64 degrees where all four launches produced damage and the lowest temperatures produced the most damage. Moreover, the chart shows that a launch in the 26-29 degree forecast range would almost certainly produce serious or catastrophic damage.
This is a version of Edward Tufte's chart, developed several years after the fact and used to illustrate visual presentation techniques. Tufte also makes the point that if a data presentation is confused, the thinking behind that presentation is probably confused as well.
Deja Vu
And then, it happened again on February 1, 2003 when the shuttle Columbia disintegrated upon reentry. The central liquid oxygen/hydrogen tank had been designed with exterior, unprotected foam insulation, like a cheap beer cooler. On many earlier flights foam disintegrated, fell and damaged heat tiles, this deviation from the original specification soon became "normal". But, eventually, an abnormally large piece of foam struck an especially sensitive tile and seven astronauts perished.
Normalization of Deviation in Manufacturing & Operations
In many operations a wide range of unproductive and wasteful practices and situations become accepted as normal. In many cases there was never a specification or definition of "normal" in the first place, so there is no deviation and therefore no re-definition . We see this most often with respect to maintenance, Inventory and setups.
When there is no specification, standard or definition of normal it is especially difficult to see that a situation is a deviation. To compound this, most of the negative consequences develop slowly and are not always clear.
Quality
Most firms have adequate specifications to determine the quality of individual products or components. However, when significant numbers of product fail to meet these specifications, the products are simply repaired or scrapped and it is assumed that such a repair is "normal." In the electronics industry they even have an innocuous word for this: "yield." In reality, any defect is a problem or deviation. Either the process is out of control or the process is not capable.
Inventory
Inventory record errors, inventory turnover and obsolete inventory are all parameters that can gradually drift out of control because the current situation is seen as normal. We have often seen inventory record accuracies below 70%, turnover less than half the industry average and more than 20% obsolete inventory. And, nobody in the organization is disturbed by these metrics!
Maintenance
In many firms, repeated equipment breakdowns and extended downtime is simply accepted as the norm. In one firm, the same overhead crane would blow fuses 3-5 times per day and nothing was ever done to find and correct the cause because this was "normal".
Setups
The most difficult part of almost any SMED effort is to convince people that setups can be reduced. They have assumed for many years that whatever they were doing was "normal" and not subject to significant improvement.
Safety
With safety, one type of Normalization of Deviation occurs when correct safety practices have been established (safety glasses, earplugs, operator training, etc.). At first, certain procedures may occasionally be ignored under extraordinary circumstances. Over time, the extraordinary circumstances become more and more frequent until they are no longer extraordinary. What was once an obvious deviation becomes the norm.
The other type of Normalization of Deviation is similar to the NASA example where a deviation (problem) arises and is subsequently redefined as "normal."
The Moral for Manufacturing
Define the norm, specification or standard of performance.
Take action whenever performance deviates from the norm.
Give people the skills to identify the problem and fix it.
Cultivate a culture that emphasizes openness and problem-solving within each work group.
Of course, the principles above have been advocated by Total Quality, Total Productive Maintenance, Six Sigma and Lean for many years. This article offers a somewhat different perspective but it leads to the same solutions. To some degree, it is just good management and good work practice.
References
TUFTE, EDWARD, "Visual Explanations: Images and Quantities, Evidence and Narrative", p. 44, Graphics Press, Cheshire, CT, 1997.
VAUGHAN, DIANE, "The Challenger Launch Decision", University of Chicago Press, Chicago, IL, 1996.
COMMITTEE ON SCIENCE & TECHNOLOGY HOUSE OF REPRESENTATIVES," Investigation of The Challenger Accident," 1986, WEB, https://www.gpo.gov/fdsys/pkg/GPO-CRPT-99hrpt1016/pdf/GPO-CRPT-99hrpt1016.pdf
■ ■ ■ ■ ■ ■ ■

|
The Strategos Guide To Value Stream and Process Mapping goes beyond symbols and arrows. In over 163 pages it tells the reader how to do it and what to do with it. |
The free newsletter of Lean strategy