


Manufacturing Focus—A Comprehensive View
Production Modes & Degrees of Focus
A Focus Algorithm
In the author's consulting practice, inappropriate manufacturing focus is frequently seen built into plant layouts. In the usual case, a functional layout is producing high or medium volume products. An example is a manufacturer of minicomputers. This company had five basic models and assembled 3-10 of each per day in a large functional assembly area. Its new plant was arranged with a small assembly line for each basic model. A smaller functional area built prototypes and replacements.
Most manufacturing (and other organizations as well) display a strong bias for the functional mode. The reasons for this bias are unclear but some possibilities are:
- Functional layouts are often easier to design.
- Accounting systems do not discourage the large inventory of functional layouts.
- Financial policies emphasize high equipment utilization and favours functional layouts.
- Engineers favour high-tech, costly, large-scale equipment which demands high utilization. This, too, favours the functional layout.
Manufacturers misuse the functional mode most often. However, any mode has the potential for misapplication. In one situation, a Detroit-style assembly line builds massive, off-road vehicles at 1.5 per day. The results are poor.
How can the layout designer achieve an optimum degree and mix of manufacturing focus? The algorithm given in Fig. 15.4 can help. The product focused modes, especially line and continuous, offer many advantages in quality, low inventory and efficiency. The Process focused functional mode is most frequently misapplied. For these reasons, the algorithm starts with a pure product focus and line production. It then backs away through the Toyota, cellular and functional modes towards a feasible alternative.
Start with an operation process chart for each distinct product. Any industrial engineering handbook or text shows the conventions for constructing these charts. Line the charts up, side by side as shown in Fig. 15.5. Each operation on a product is a product operation (PO). In the typical situation, a single PO requires too little time and equipment for a dedicated workstation or department. The layout designer must somehow group various POs.
One method is to group all product operations which require the same equipment or type of process. Envelope “A” Fig. 15.5 illustrate this. Such grouping provides a pure Process focus. At the other extreme, a designer might group all operations required by a single product. He would then locate these in a single product department or workstation. Envelope “B” in Fig. 15.5 illustrates this. This is a pure product focus.
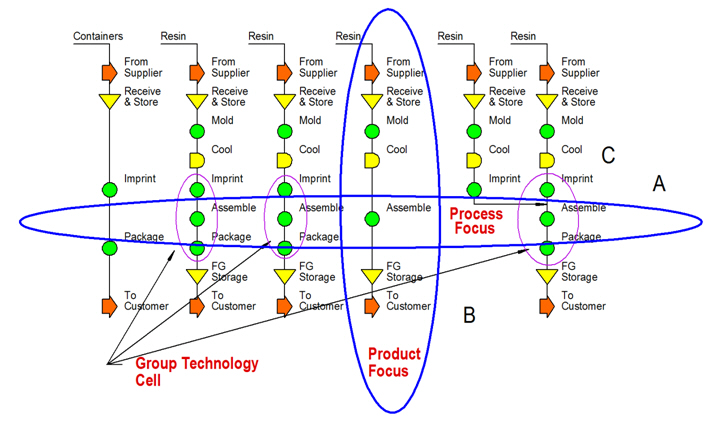
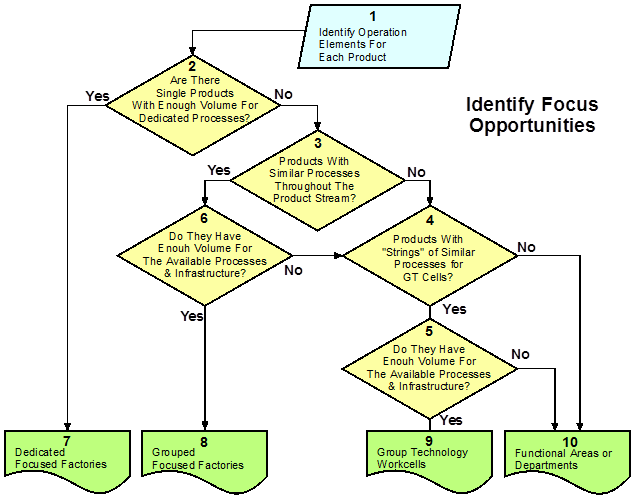
Figure 4 A Focus Algorithm
In Step 2, the designer examines each product for a trial product focused grouping. There are only two valid reasons for rejecting a pure product focus:
- The available feasible processes have a large scale with respect to product volume. They cannot economically process a single product; for example, a small turned pin requires only 0.25 machine hours per week for the anticipated product volume.
- Some element of infrastructure has a large scale with respect to product volume. It cannot reasonably serve a single product; for example, a highly skilled electronic technician calibrates a circuit board. Production only requires his skills about two hours per week.
If a trial product passes both tests, it should have its own manufacturing area and possibly its own PWP. Remove such products from further consideration.
In Step 3, the designer examines each remaining product. He identifies subsets of the manufacturing operations (strings) which are common between two or more products. When such a string occurs, the designer tests it for adequate volume vis-à-vis process and infrastructure scale. If it passes the test, such operation strings become group technology cells, as illustrated in Fig. 15.5.
Step 4 aggregates all remaining operations into functional areas.
The identified areas become basic cells for developing layouts. Such layout cells may be GT cells, functional cells or product cells.
An analyst might perform this focusing task on paper as illustrated. More often, the algorithm structures the thought process and may arrive at a cell definition without formally drawing all operation process charts. The designer may also use the production flow Analysis technique developed by Burbidge or the techniques of a coding and classification approach. These techniques are particularly useful when dealing with hundreds or thousands of parts or products. Such traditional grouping techniques should supplement rather than displace the above algorithm.

■ ■ ■ ■ ■ ■ ■

|
The Strategos Guide To Value Stream and Process Mapping goes beyond symbols and arrows. In over 163 pages it tells the reader how to do it and what to do with it. |
The free newsletter of Lean strategy